
Figure 1.
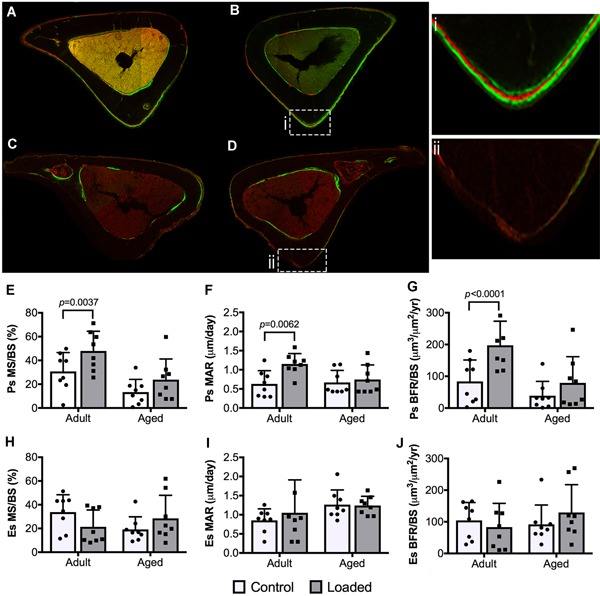
Representative images of transverse sections at tibial midshaft showing fluorochrome bone labels (calcein green and Alizarin Red) on bone surfaces in adult and aged control and loaded mouse tibias: (A) 16‐week‐old control tibia; (B) 16‐week‐old loaded tibia; (B.i) fluorochrome triple labels at the periosteal (Ps) surface; (C) 52‐week‐old control tibia; (D) 52‐week‐old loaded tibia; (D.ii) Ps surface void of fluorochrome labels. (E,H) Mineralizing surface (MS/BS, %), (F,I) mineral apposition rate (MAR, μm/day), and (G,J) bone formation rates (BFR/BS, μm3/μm2/year) at the Ps and endosteal (Es) surfaces. Data were analyzed using a two‐way repeated measures ANOVA with a Šídák post hoc analysis for multiple comparisons at α = 0.05.