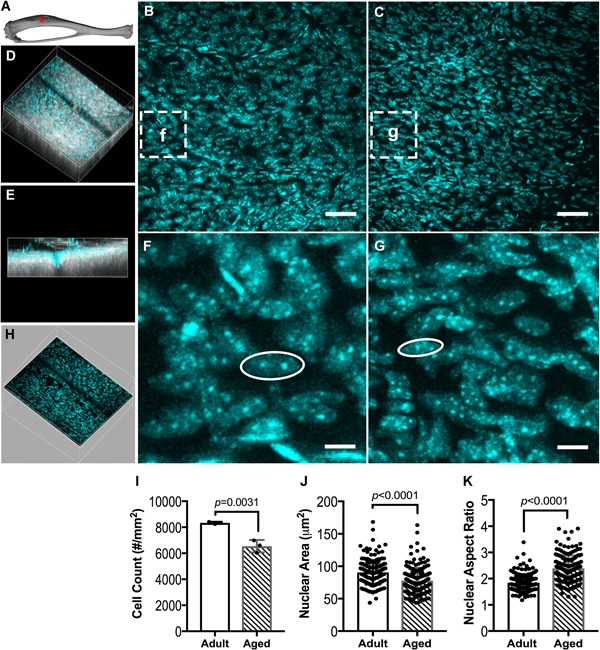
Figure 2.

Periosteal DAPI staining of the (A) tibial anteromedial region (red asterisk). Representative z‐projection images of (B) adult and (C) aged periosteal cells, derived from periosteal volumes of interest. (D) Example of an image stack volume showing second harmonic generation (SHG, white) of cortical bone and DAPI stained cells (cyan), with (E) the corresponding side view. Magnified images of DAPI stained periosteal cells of (F) adult and (G) aged mice. Periosteal volume of interest (H) was separated from the raw image volume using SHG to distinguish cortical bone cells from periosteal cells. (I) Cell number, (J) nuclear area, and (K) nuclear aspect ratio of DAPI stained cells in adult and aged periosteum. Data are presented as mean ± SD. Scale bars in B, C = 50 µm. Scale bars in F, G = 5 µm.
