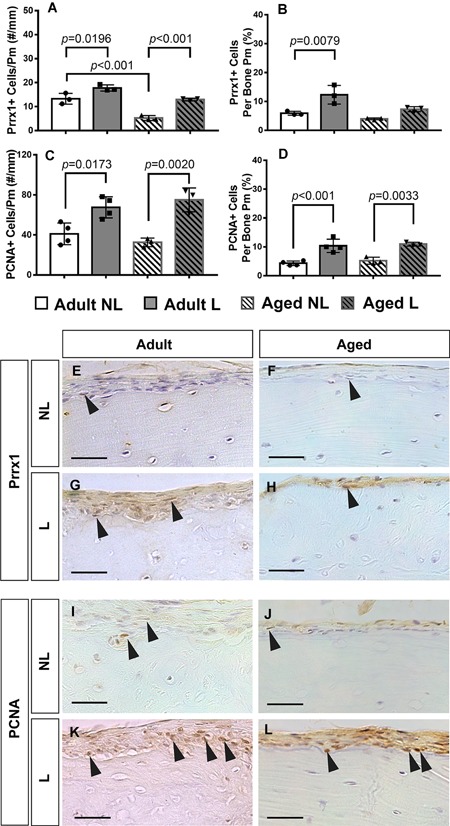
Figure 3.

Quantification of Prrx1 + and PCNA + periosteal cells from immunohistochemical staining of thin paraffin‐embedded tissue sections from adult and aged nonloaded (NL) and loaded (L) tibias. (A) Prrx1 + cell number normalized to periosteal perimeter and (B) as the percentage of total cells. (C) PCNA + proliferating cell number normalized to periosteal perimeter and (D) the percentage of total cells. Representative images of the periosteum stained for Prrx1 (E–H) and PCNA (I–L) for all experimental groups. Black arrows denote positively stained cells. Scale bars = 50 µm.
