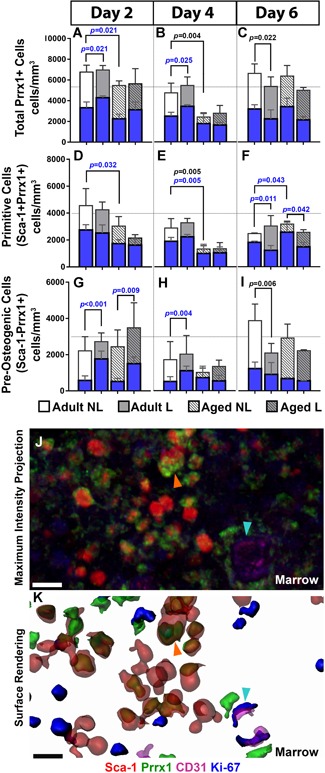
Figure 6.

Quantification of marrow‐resident cell populations in adult and aged nonloaded (NL) and loaded (L) tibias using deep‐tissue immunohistochemistry. Total cell numbers are represented by white and gray bars, and proliferating cell number within each of these populations are represented by blue bars. (A–C) Total Prrx1 + , (D–F) Sca‐1+Prrx1+ and (G–I) Sca‐1−Prrx1+ cell number at days 2, 4, and 6. Representative image of the marrow from adult loaded bone displayed in a (J) maximum intensity projection and the corresponding (K) surface rendering showing Sca‐1 + (red), Prrx1 + (green), Ki‐67 + (blue), and CD31 + (magenta) cells. The marrow contains resting Sca‐1+Prrx1+ Ki‐67– cells (orange arrow) and proliferating CD31 + Ki‐67 + endothelial cells (aqua arrow). Significant differences between total cell number are indicated by p values shown in black. Significant differences between proliferating cell numbers are indicated by p values shown in blue. Scale bars = 5 µm.
