
Figure 4.
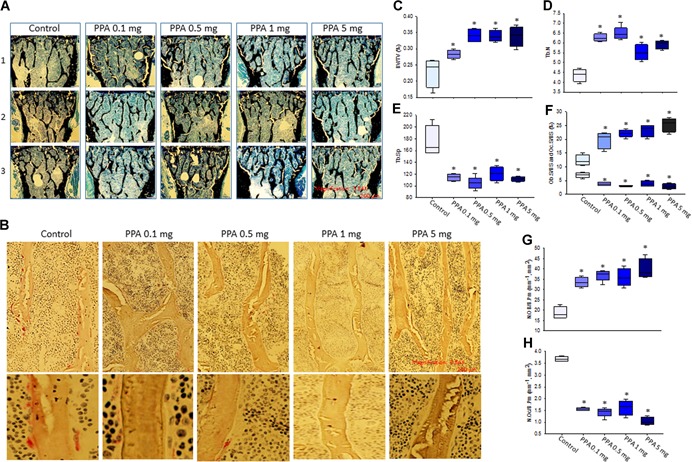
Histomorphometry and histology on L5 vertebrae shows increased bone formation in PPA‐treated mice. (A) Von Kossa staining on L5 vertebrae for histomorphometric analysis. Pictures represent three (1, 2, 3) individual mouse per each group, control, PPA 0.1 mg/kg/d (0.1 mg) to 5 mg/kg/d (5 mg) treatments, black lines show trabecular bone. Magnification 3.84 × , 200 µm, 4 × /0.13 PhL lens. (B) TRAPase staining on L5 vertebrae, pictures show one mouse per each group, red dots are TRAPase‐positive osteoclastic cells. Upper part pictures, magnification × 3.84, 200 µm, 20 × /0.4 Phc lens; lower part pictures, magnification 3.84 × , 200 µm, 40 × /0.55 Ph2 lens. Parameters from histomorphometric analysis, (C) BV/TV (%); (D) Tb.N; (E) Tb.Sp; (F) Ob.S/BS and Oc.S/BS; (G) N.OB/B.Pm; (H) N.OC/B.Pm. Data bars are expressed as mean ± SE (n = 5/group). Significant differences indicated by p < 0.05, *compared to control group. BV/TV = bone volume per total volume; Tb.N = trabecular number; Tb.Sp = trabecular separation; Ob.S/BS = osteoblast surface per bone surface; Oc.S/BS = osteoclast surface per bone surface; N.OB/B.Pm = number of osteoblast per bone parameter; N.OC/B.Pm = number of osteoclast per bone parameter; TRAPase = tartrate‐resistant acid phosphatase; PhL = Phase L; Phc = Phase C; Ph2 = Phase 2.