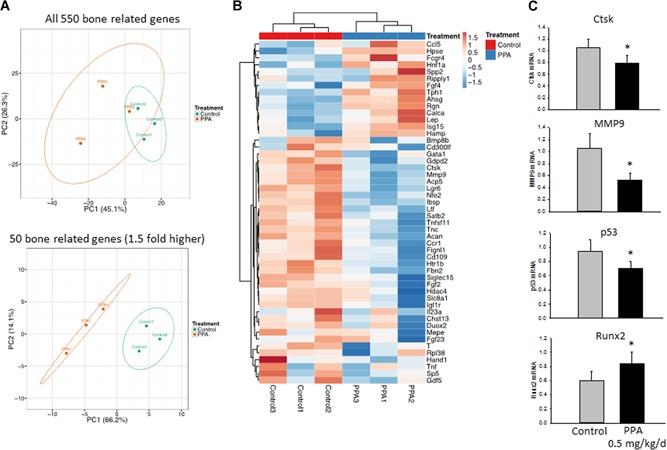
Figure 7.

RNA‐sequencing data of significantly fold‐changed genes possibly involved in bone formation or resorption in bone between two treatment groups. (A) Principal component analysis of predicted functional metagenomics pathways of all 550 bone‐related genes and 1.5‐fold changed 50 bone‐related genes using the PICRUSt bioinformatics software package. (B) Heat map of 1.5‐fold changed 50 bone‐related genes representing three pools (control 1, 2, 3 versus 0.5 mg/kg/day PPA treatment 1, 2, 3). (C) Real‐time PCR confirms gene expression of Ctsk and MMP9 (plus p53 and Runx2 were not included in the list) between two groups. Significant differences indicated by p < 0.05, *0.5 mg/kg/day PPA treatment compared to either control. Ctsk = cathepsin K.
