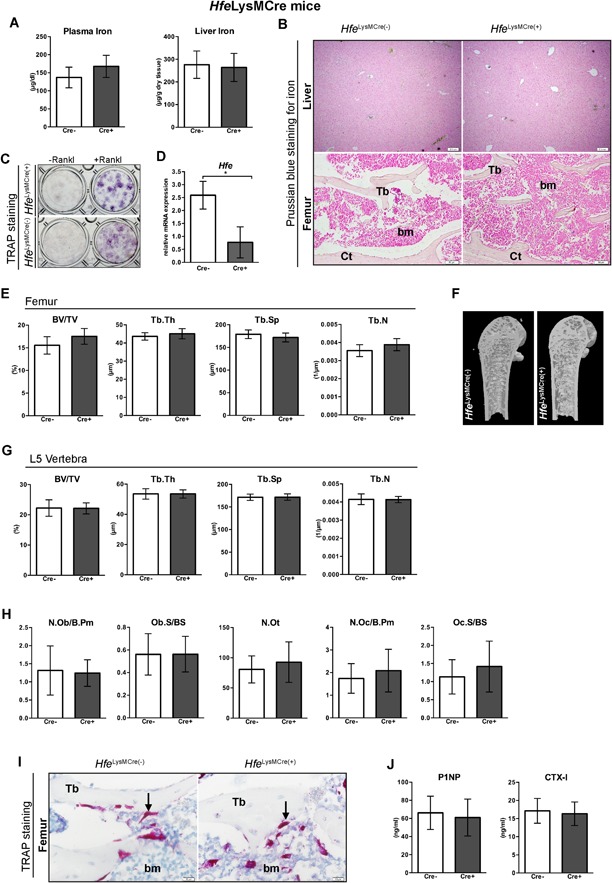
Figure 2.

Hfe actions in osteoclasts are nonessential for the regulation of iron and bone metabolism. (A) Iron levels in the blood and the liver of Hfe LysMCre(+) and Hfe LysMCre(−) mice (n = 3; 6). (B) Prussian blue staining for iron depositions in the liver and femoral bone (decalcified) of Hfe LysMCre(+) and Hfe LysMCre(−). Images are representative staining of three mice per each group. The pictures represent 40× (liver) and 100× (bone) magnification. (C) Representative images of differentiated osteoclasts from Hfe LysMCre(+) and Hfe LysMCre(−) mice (n = 3; 3). (D) mRNA expression of Hfe in cultured osteoclasts from Hfe LysMCre(+) mutant mice measured by quantitative real‐time PCR and calculated relative to the expression of the reference gene Gapdh (n = 3; 4). (E, G) µCT analysis of trabecular bone at distal femur and in the vertebra of Hfe LysMCre(+) and Hfe LysMCre(−) mice (n = 6; 8). (F) µCT 3D models of femora showing no evident changes in the composition of the trabecular bone, cortical bone, and marrow area. Images are representative of three mice per each group. (H) Histomorphometry showing no significant changes in osteoblast, osteocyte, and osteoclast numbers between Hfe LysMCre(+) and Hfe LysMCre(−) mice (n = 4; 4). (I) TRAP‐positive cells in bone sections are indicated by an arrow and are stained red. Images are representative staining of three mice per each group. The pictures represent 400× magnification. (J) The expression levels of bone formation marker P1NP, and bone resorption marker C‐terminal collagen crosslinks telopeptide 1 (CTX‐I) in the serum of Hfe LysMCre(+) and Hfe LysMCre(−) mice (n = 6; 6). Data were analyzed using GraphPad Prism software and results are shown as mean ± SD. For the statistical analysis, a nonparametric distribution and the Mann‐Whitney U test were used. *p values < .05. All mice were males 13 weeks of age. BV/TV = bone volume/tissue volume; Tb.Sp = trabecular separation; Tb.Th = trabecular thickness; Tb.N = trabecular number; Tb = trabecular bone; Ct = cortical bone; bm = bone marrow; TRAP = tartrate‐resistant acid phosphatase; RANK‐L = receptor activator of NF‐κB ligand; N.Ob/B.Pm = osteoblast number/bone perimeter; Ob.S/BS = osteoblast surface/bone surface; N.Ot = osteocyte number; N.Oc/B.Pm = osteoclast number/bone perimeter; Oc.S/BS = osteoclast surface/bone surface; Tb = trabecula; bm = bone marrow.
