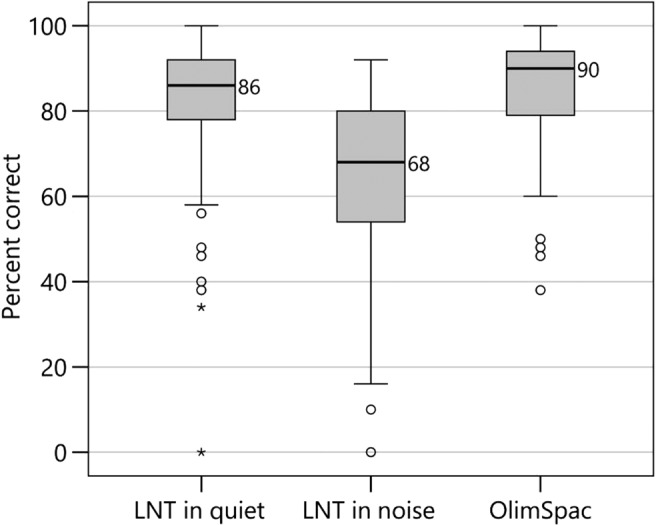
Figure 3.

Box plots from left to right show segmental speech perception scores in percent correct for children with cochlear implants for the Lexical Neighborhood Test (LNT) in Quiet, LNT in Noise, and On-Line Imitative Test of Speech-Pattern Contrast Perception (OlimSpac). The limits of the box represent the lower and upper quartile of the distribution (the difference is the interquartile range [IQR]), and the horizontal line through the box represents the median (median values are displayed next to the line). Whiskers represent the minimum and maximum scores in the distribution, excluding any outliers. Open-circle outliers are values between 1.5 and 3 IQRs from the end of a box; asterisk outliers are values more than 3 IQRs from the end of a box.
