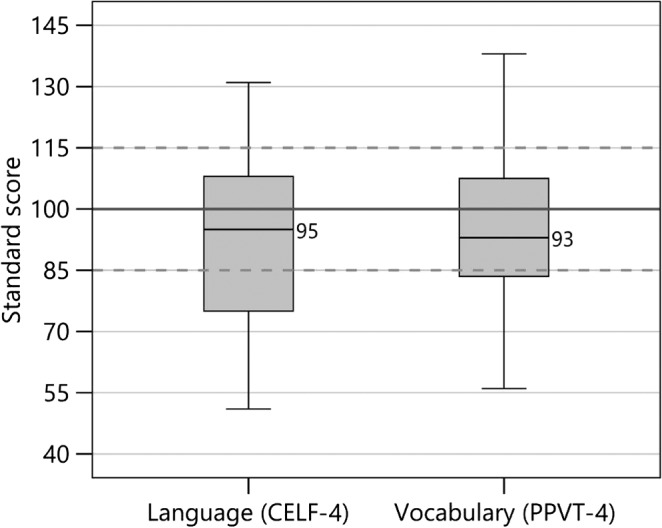
Figure 5.

Box plots from left to right show standard scores (mean of 100 shown by solid line and standard deviation of ±15 shown by dashed lines) for children with cochlear implants for the receptive language index from Clinical Evaluation of Language Fundamentals–Fourth Edition (CELF-4) and Peabody Picture Vocabulary Test–Fourth Edition (PPVT-4). Details about the box plots' structure are the same as those described in the caption for Figure 3.
