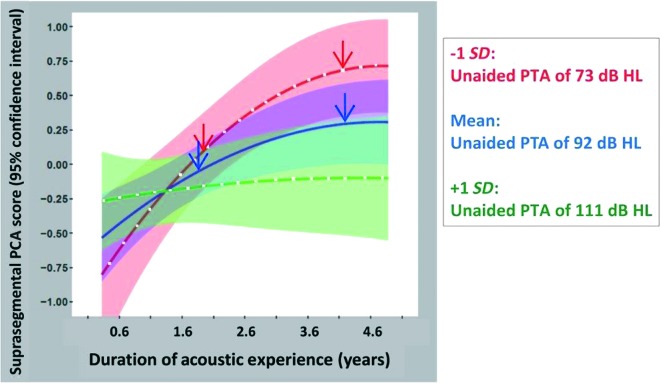
Figure 7.
Predicted suprasegmental principal components analysis (PCA; standardized with mean at 0 and ± 1 SD) scores, using the full regression model, are plotted as a function of duration of acoustic experience with unaided pure-tone average (PTA) as a parameter. Mean suprasegmental PCA scores and 95% confidence intervals for the mean are plotted on the graph for three unaided PTA values (mean − 1 SD, overall mean, and mean + 1 SD for the study population)—specifically, unaided PTA = 73 dB HL (red line and red shaded area), unaided PTA = 92 dB HL (blue line and blue shaded area), and unaided PTA = 111 dB HL (green line and green shaded area).

