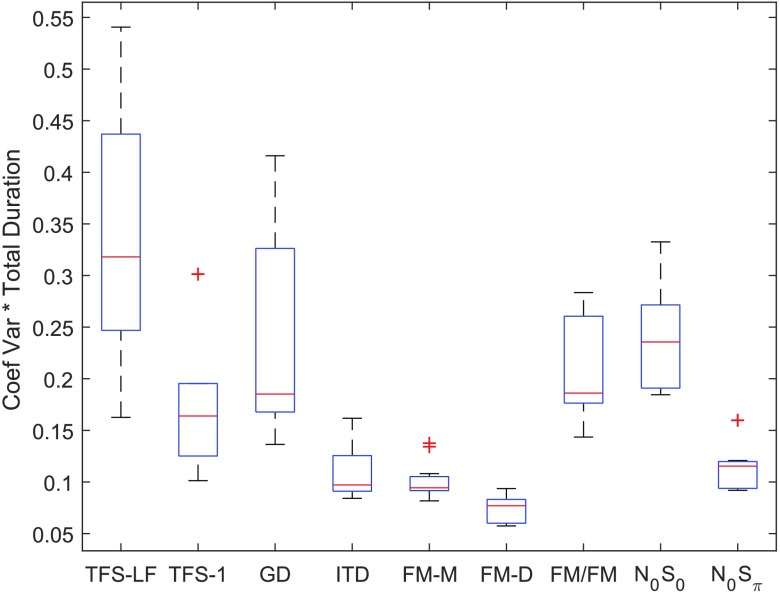
Figure 11.
The product of coefficient of variation and total test duration for each measure as an index of the efficiency similar to sweat factor. Higher numbers indicate that more time was needed to obtain the same accuracy of threshold estimate. TFS-LF = TFS–low frequency (interaural phase difference detection); TFS-1 = frequency shift detection; GD = gap discrimination; ITD = interaural time difference; FM-M = FM detection–monaural; FM-D = FM detection–diotic; FM/FM = FM detection–dichotic; N0S0 = homophasic tone detection in noise; N0Sπ = antiphasic tone detection in noise.

 This work is licensed under a