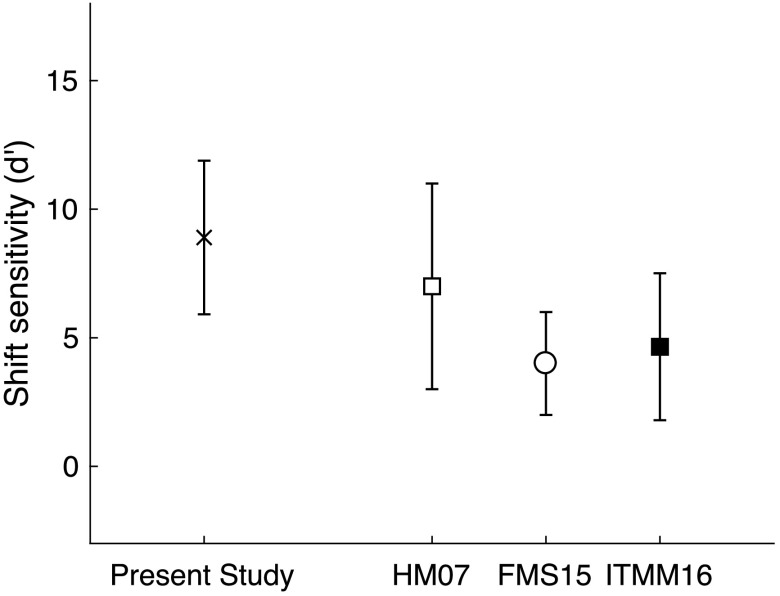
Figure 2.
Mean and standard deviation for sensitivity to a shift in frequency for the TFS-1 in studies using similar methods, plotted in a derived estimate of d′ described in Hopkins and Moore (2007). Studies differed slightly in the number and shape of harmonic complex stimuli. MH07 is data from Hopkins and Moore for Harmonics 9–13 of 100 Hz in a flat passband and 30 dB/octave slopes above and below. FMS15 is data from Füllgrabe et al. (2015) for a harmonic complex with 30 dB/octave slopes above and below Harmonic 11 of 91 Hz. ITMM16 data were compiled visually from listeners under age of 40 years in Figure 3 of Innes-Brown et al. (2016); stimuli included Harmonics 9–13 of 100 Hz, and filter slope was not reported. Thresholds from this study (frequency shift detection, TFS-1) included Harmonics 10–19 with a Hanning spectral envelope centered at Harmonic 15. Despite minor differences in passband location and shape, sensitivity across the different measures were consistent across studies, with better performance reported in this study discussed in the text.

 This work is licensed under a