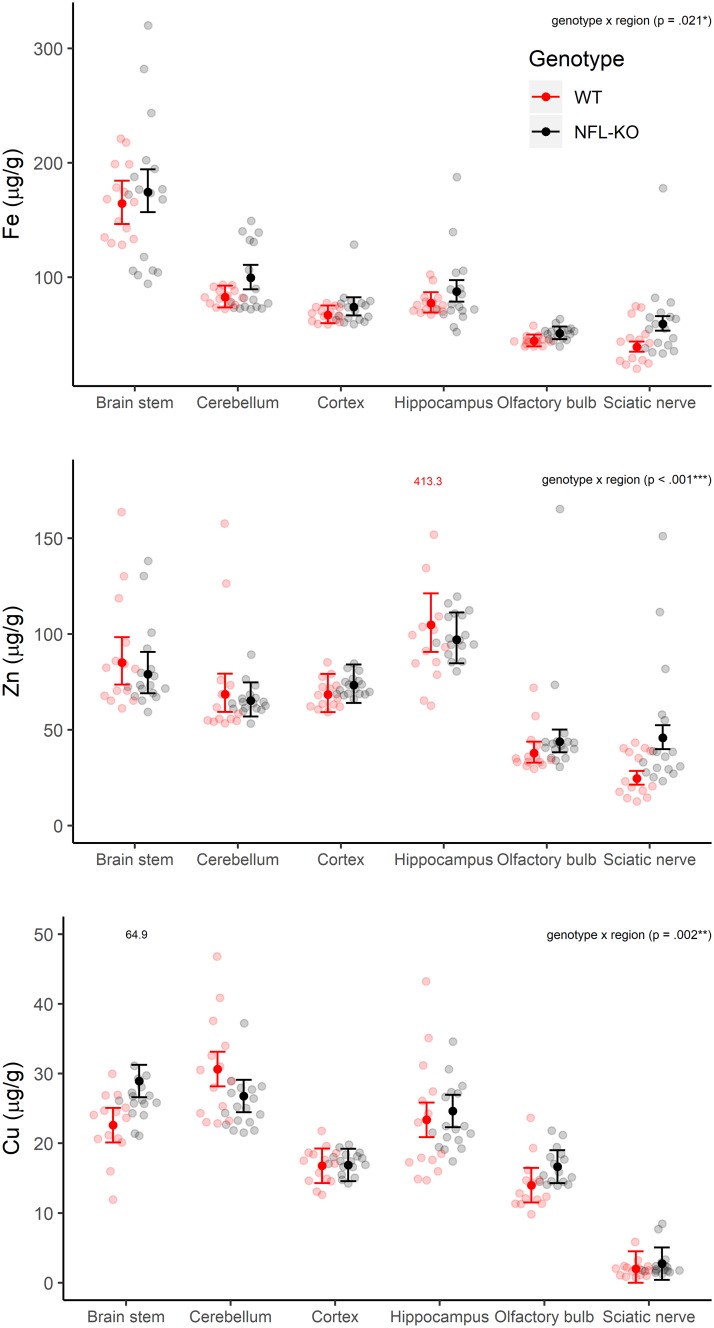
Fig 2. Metal variability in different brain regions.
Estimated marginal means (and 95% CI) show patterns of Fe, Zn, and Cu composition in different brain regions for the two genotypes (WT and NFL-KO; averaged over 5mo and 22mo animals). There were significant genotype x region interactions for Zn, Fe and Cu (Zn: F(5, 140) = 8, p < .001; Fe: F(5, 140) = 3, p = .021; F(5, 139) = 4, p = .002).

