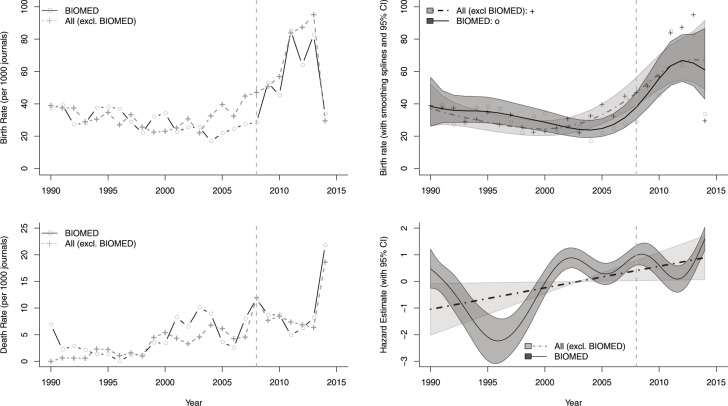
Fig 2. Relationship between birth and death rates in biomedical journals and in other fields.
On the left-hand side, observed birth and death rates per 1,000 journals between 1990 and 2015 are presented. In the right-hand column are thin plate splines (with 95% confidence intervals in gray) that smooth year-to-year birth and death rates for observed birth rates and for hazard rate estimates from a Cox proportional hazard model, using the journal age as the timescale. The vertical reference line marks the year 2008. BIOMED, Biomedical.

