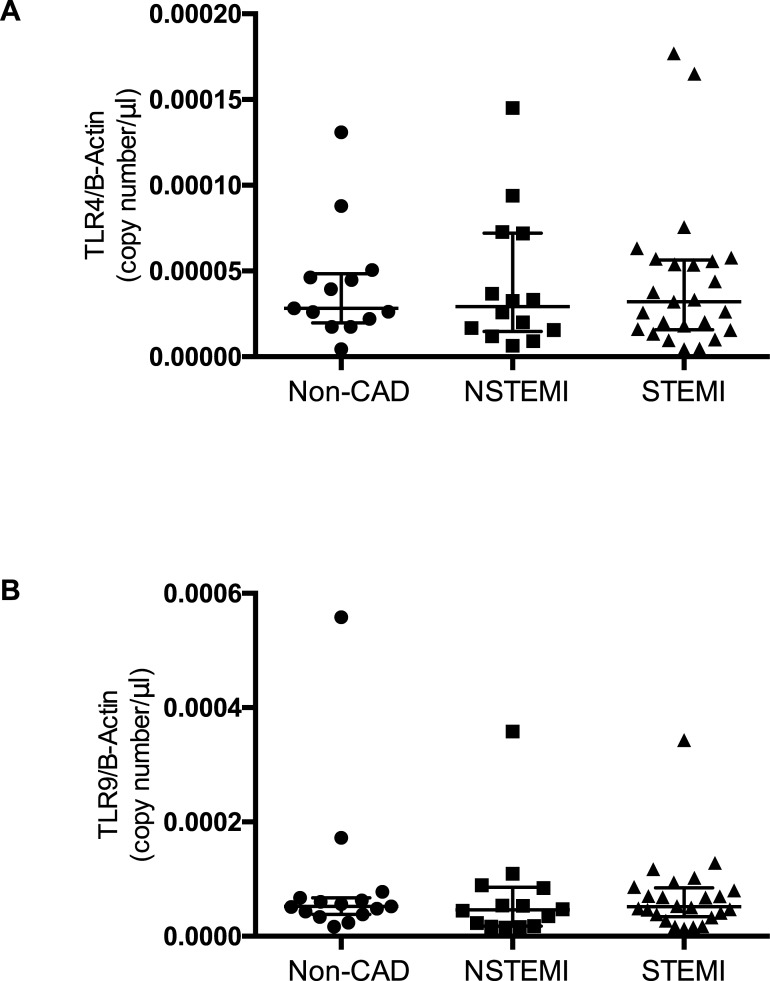
Fig 3. TLR4 and -9 mRNA expression in plates.
TLR4 (A) and TLR9 (B) mRNA expression levels in platelets isolated from patients with ACS and in patients with via percutaneous interventional coronarangiography excluded coronary artery disease Data are presented as scatter plots with median and interquartile range.

