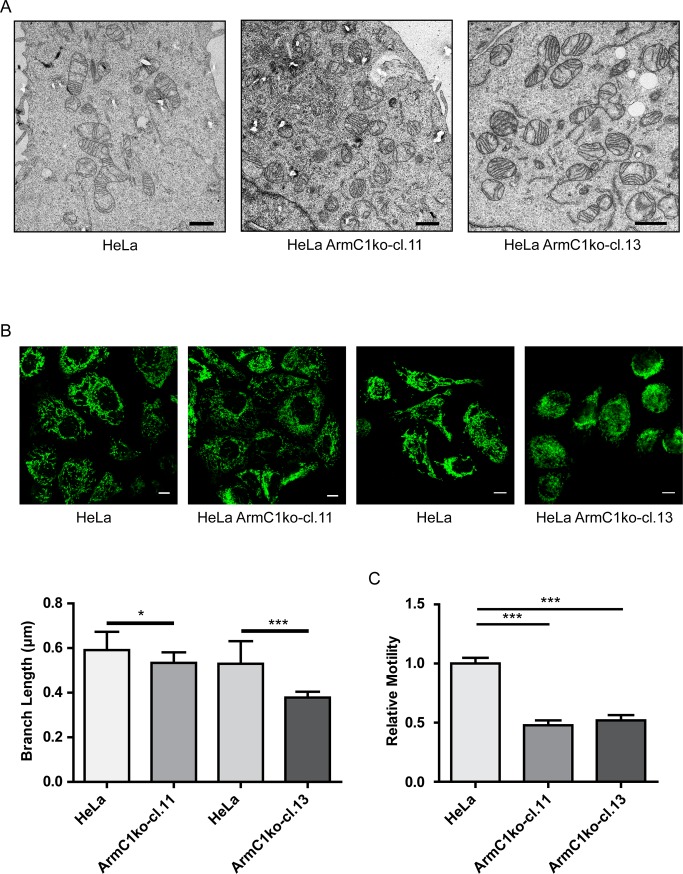
Fig 6. Mitochondrial ultrastructure, morphology and dynamics in ArmC1 knockout cells.
(A) Cells of wildtype HeLa and two ArmC1 knockout cell lines were seeded on coverslips, and after fixation with 2.5% glutaraldehyde prepared and analyzed by transmission electron microscopy. Scale bar is 1 μm. (B) Wildtype HeLa and two ArmC1 knockout cell lines were seeded on coverslips, fixed and stained with antibodies against translocase of the outer membrane (Tom20) protein and secondary antibodies coupled to the Cy2 fluorophore. Pictures were made using confocal microscopy and average mitochondrial branch length was calculated from 10 random fields of view, each containing at least 5 cells. Scale bar is 10 μm. The graph represents mean values ±SD. Significance was calculated using Student’s t test.: *—p≤0.05, ***—p≤0.001. (C) Cells as in A and B were transfected with the pCDNA3 plasmid carrying information for the mitochondrial matrix targeted GFP (CoxVa presequence-GFP), stained with SIR-tubulin and imaged once per minute by confocal microscope for 10–15 minutes. Mitochondrial motility between the frames was measured and normalized to wildtype HeLa results. The graph represents mean values ±SD. Significance was calculated using Student’s t test.: ***—p≤0.001.

