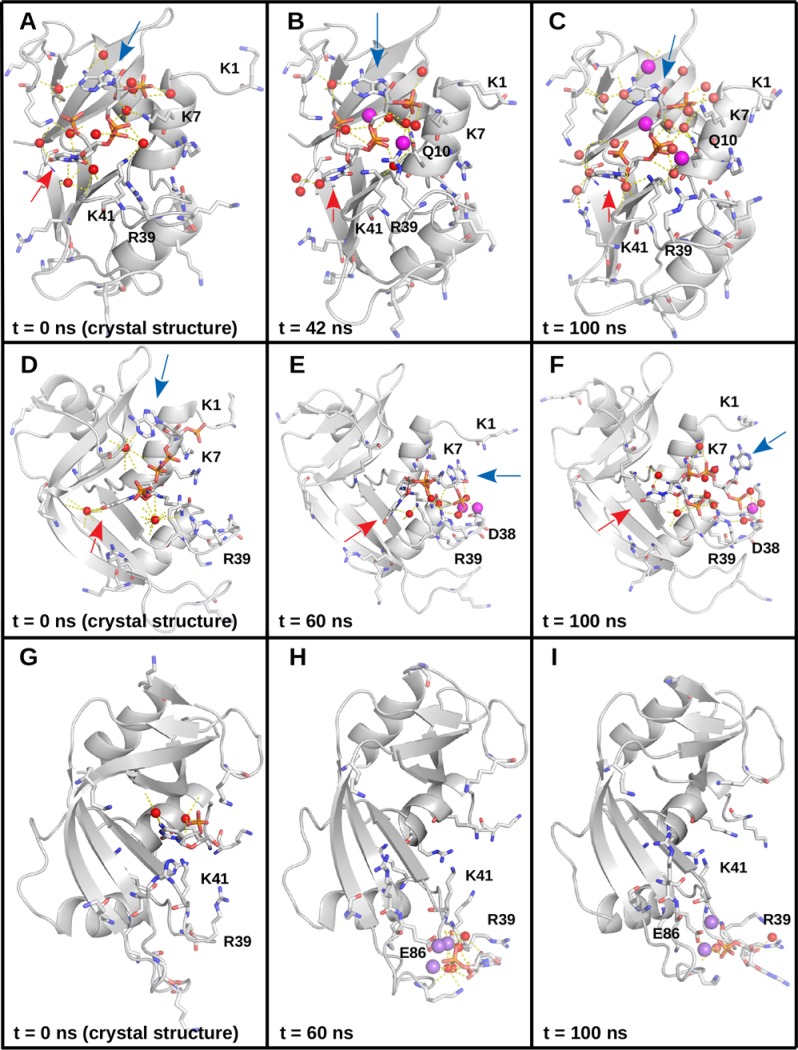
Fig 7. Comparison between crystal and simulated structures.
(A) The RNase A–PUA complex from a crystal structure. The protein backbone is in cartoon representation, colored in gray. Lysines, arginines, and the ligand are given in stick representation with carbon atoms in white, nitrogens in blue, oxygens in red, and phosphorus in orange. Certain lysine and arginine residues are labeled. Water oxygens are represented as red spheres, polar contacts are shown as dashed lines. The locations of the urydyl and adenosyl moieties are indicated with a red and a blue arrow, respectively. (B) The RNase A–PUA complex after 42 ns of production dynamics. The protein backbone is in cartoon representation, colored in gray. Lysines, arginines, Q10, and the ligand are given in stick representation with carbon atoms in white, nitrogens in blue, oxygens in red, and phosphorus in orange. Certain lysine and arginine residues and Q10 are labeled. Water oxygens are represented as red spheres; sodium ions are represented as magenta spheres; polar contacts are shown as dashed lines. The locations of the urydyl and adenosyl moieties are indicated with a red and a blue arrow, respectively. (C) The RNase A–PUA complex after 100 ns of production dynamics. The protein backbone is in cartoon representation, colored in gray. Lysines, arginines, Q10, and the ligand are given in stick representation with carbon atoms in white, nitrogens in blue, oxygens in red, and phosphorus in orange. Certain lysine and arginine residues and Q10 are labeled. Water oxygens are represented as red spheres; sodium ions are represented as magenta spheres; polar contacts are shown as dashed lines. The locations of the urydyl and adenosyl moieties are indicated with a red and a blue arrow, respectively. (D) The RNase A–PAX complex from a crystal structure. The protein backbone is in cartoon representation, colored in gray. Lysines, arginines, and the ligand are given in stick representation with carbon atoms in white, nitrogens in blue, oxygens in red, and phosphorus in orange. Certain lysine and arginine residues are labeled. Water oxygens are represented as red spheres, polar contacts are shown as dashed lines. The locations of the thymine and adenosyl moieties are indicated with a red and a blue arrow, respectively. (E) The RNase A–PAX complex after 60 ns of production dynamics. The protein backbone is in cartoon representation, colored in gray. Lysines, arginines, and the ligand are given in stick representation with carbon atoms in white, nitrogens in blue, oxygens in red, and phosphorus in orange. Certain lysine and arginine residues are labeled. Water oxygens are represented as red spheres; sodium ions are represented as magenta spheres; polar contacts are shown as dashed lines. The locations of the thymine and adenosyl moieties are indicated with a red and a blue arrow, respectively. (F) The RNase A–PAX complex after 100 ns of production dynamics. The protein backbone is in cartoon representation, colored in gray. Lysines, arginines, and the ligand are given in stick representation with carbon atoms in white, nitrogens in blue, oxygens in red, and phosphorus in orange. Certain lysine and arginine residues are labeled. Water oxygens are represented as red spheres; sodium ions are represented as magenta spheres; polar contacts are shown as dashed lines. The locations of the thymine and adenosyl moieties are indicated with a red and a blue arrow, respectively. (G) The RNase A–C3P complex from a crystal structure. The protein backbone is in cartoon representation, colored in gray. Lysines, arginines, and the ligand are given in stick representation with carbon atoms in white, nitrogens in blue, oxygens in red, and phosphorus in orange. Certain lysine and arginine residues are labeled. Water oxygens are represented as red spheres, polar contacts are shown as dashed lines. (H) The RNase A–C3P complex after 60 ns of production dynamics. The protein backbone is in cartoon representation, colored in gray. Lysines, arginines, and the ligand are given in stick representation with carbon atoms in white, nitrogens in blue, oxygens in red, and phosphorus in orange. Certain lysine and arginine residues are labeled. Water oxygens are represented as red spheres; sodium ions are represented as magenta spheres; polar contacts are shown as dashed lines. (I) The RNase A–C3P complex after 100 ns of production dynamics. The protein backbone is in cartoon representation, colored in gray. Lysines, arginines, and the ligand are given in stick representation with carbon atoms in white, nitrogens in blue, oxygens in red, and phosphorus in orange. Certain lysine and arginine residues are labeled. Water oxygens are represented as red spheres; sodium ions are represented as magenta spheres; polar contacts are shown as dashed lines.

