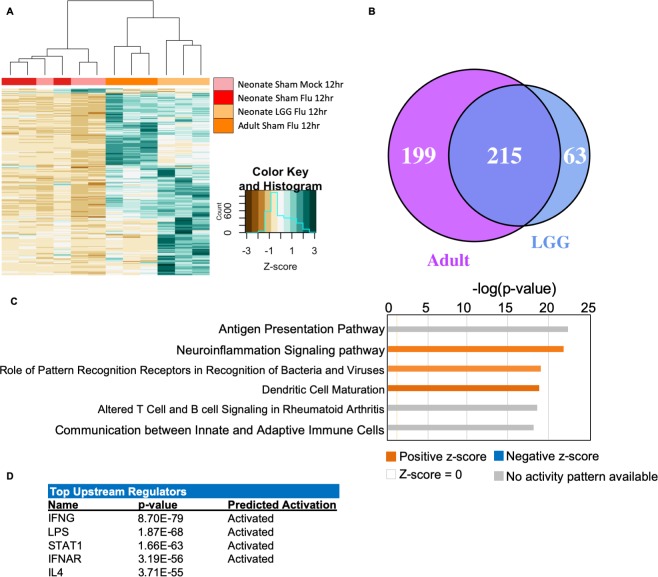
Fig 4. Lactobacillus causes differential transcriptional response to influenza.
Neonatal animals were given either LGG or sham treatment, and then infected with influenza on the third day of life. Animals were harvested 12 hours post-infection. Nanostring gene transcription analysis was performed on lungs. (A) Heatmap of all genes test in the LGG treated neonates, compared to expression in the other groups. Green: Upregulated; Brown: Down regulated. N = 3–4 per group, 2 experiments. (B) Venn diagram depicting the overlap of differentially regulated genes in the adult and the LGG-treated neonate. (C) IPA analysis of canonical pathways upregulated in the LGG-treated neonates. Significance P-values were calculated based on the Fisher's right tailed exact test. The log (p-value) are shown on the x-axis of the bar chart. The color of the bars indicates the activity (orange bars) or the inhibition (blue bars) of the predicted pathways. (D) IPA Top upstream regulators of gene expression in LGG-treated neonates versus uninfected neonates.

