
Fig. 2.
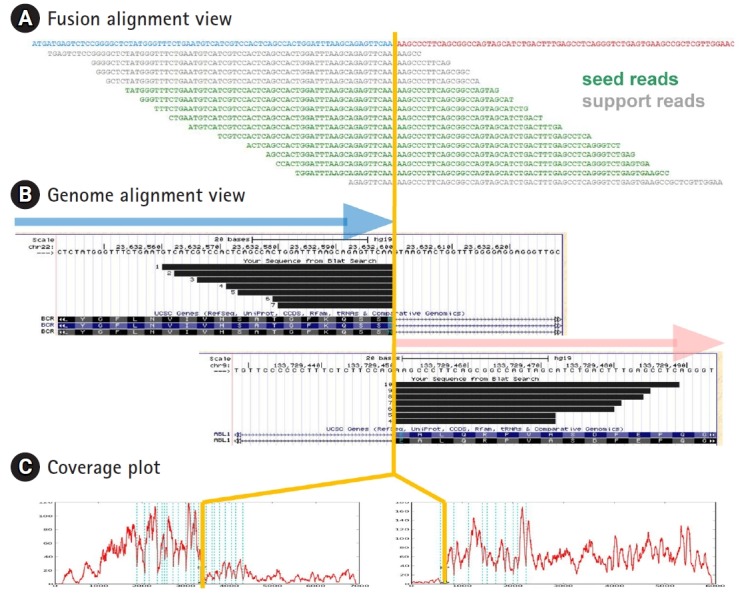
Alignment and coverage plots. BCR-ABL1 gene fusion detected from RNA sequencing data of K562 cell line is shown as an example. (A) Fusion alignment view is the read alignment of seed and support reads on hypothetical fusion transcript. (B) Genome alignment view shows the alignment of split reads on the University of California Santa Cruz (UCSC) genome browser for head and tail genes obtained by BLAT alignment tool. (C) Coverage plots on transcript coordinate show abrupt change in read depth at the fusion boundary for both head and tail genes. Blue vertical lines indicate the exon boundaries in each gene.