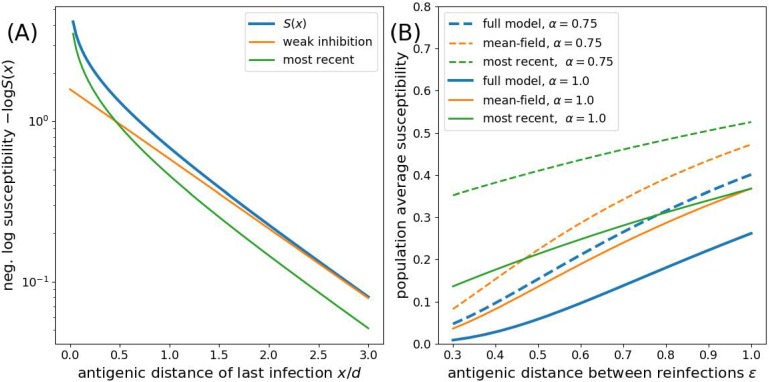
Appendix 1—figure 1. Approximations to the susceptibility.
Panel A shows the effect of approximating the multiplicative effect of all past infection by (weak inhibition) and by ignoring all by the most recent infection. Panel B shows the population average susceptibility assuming every individual gets reinfected once the virus has evolved by for the multiplicative model, the mean field approximation, and the most recent infection approximation for different values of as a function of the interval between infections .

