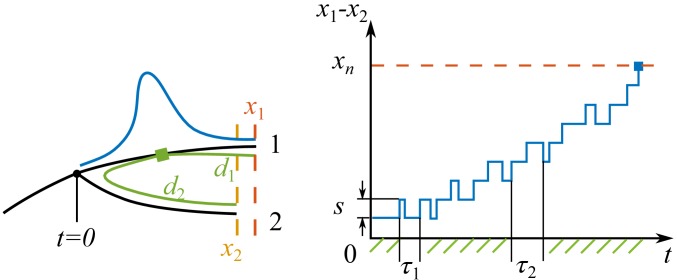
Appendix 5—figure 1. Process of speciation.
Left: Sketch of a branching event at with two branches 1 and 2. The fitnesses of the most fittest strains (noses) in branch 1 and 2 are and . Branch 1 is the fitter one . The antigenic distances from the cross-immune bulk to the noses of the two branches are and . The Gaussian profile in fitness is illustrated in blue. Right: The fitness difference between the two branches is doing a biased random walk in time of step size with a reflecting boundary at and an absorbing boundary at .

