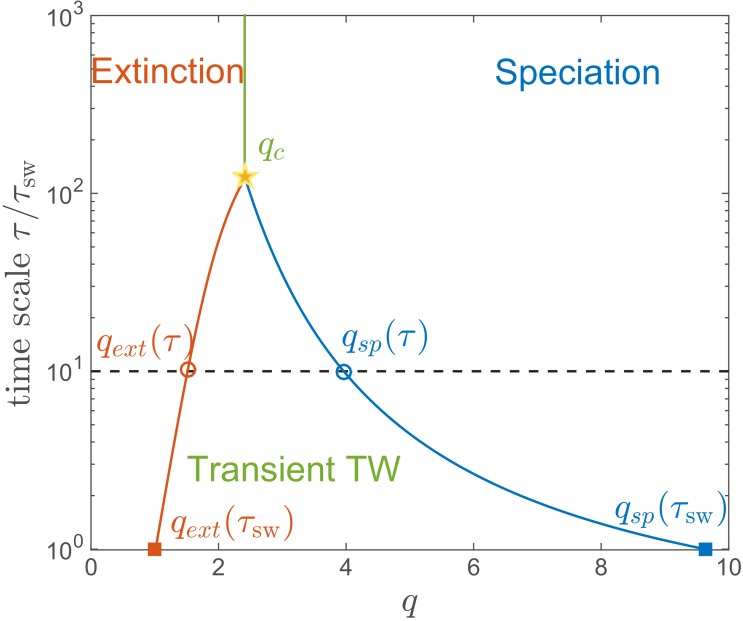
Figure 7. Lifetime of the RQS state.
This schematic diagram based on Figure 5A defines the ‘boundaries’ of the transient RQS (red line) and (blue line). gives the value of for which the average time to extinction is equal to is defined similarly but for the speciation process. Average times to speciation and extinction become equal at the critical value at which RQS persists the longest. For , and this value, along with the RQS lifetime, increases with .

