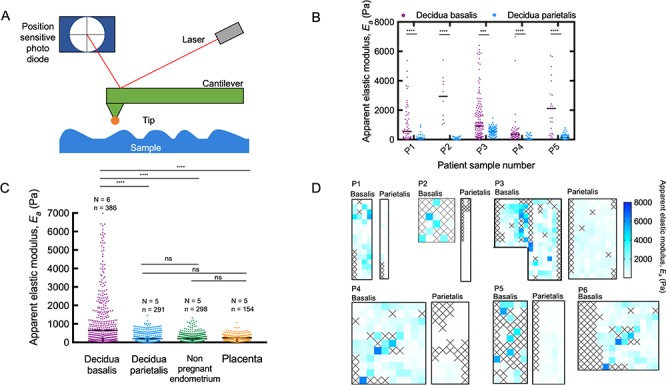
Figure 2.

AFM measurements showing increased stiffness of decidua basalis. (A) AFM was used to determine the stiffness of samples by measuring the force between a cantilever and the sample in a feedback mechanism. The reflected laser beam strikes a position-sensitive photo diode consisting of a four segment photo detector, and this is used to determine the angular deflections of the cantilever. The Hertz model can be used to estimate the apparent elastic modulus, Ea. (B) Decidua basalis was stiffer than decidua parietalis in five patient-matched samples (Mann–Whitney; ****P < 0.0001; ***P < 0.001; number of measurement points in each sample ranged from n = 10 to 148). Black bars show median for each sample. (C) A comparison of the apparent elastic modulus for decidua basalis, decidua parietalis, nonpregnant endometrium, and placenta villi; values measured for all samples are shown together. Black bars show median for each sample type (Kruskal–Wallis ANOVA with multiple comparison tests between groups; ****P < 0.001; ns means nonsignificant; N, number of patient samples; n, number of measurements). (D) Map of apparent elastic modulus values for decidua basalis and parietalis in paired samples. Each square has an area of 20 × 20μm, inside which a single measurement was taken; squares colored according to scale bar on right. Crosses represent where a clean measurement could not be taken; these are determined by evaluating the force–displacement curves manually during post-experiment analysis.
