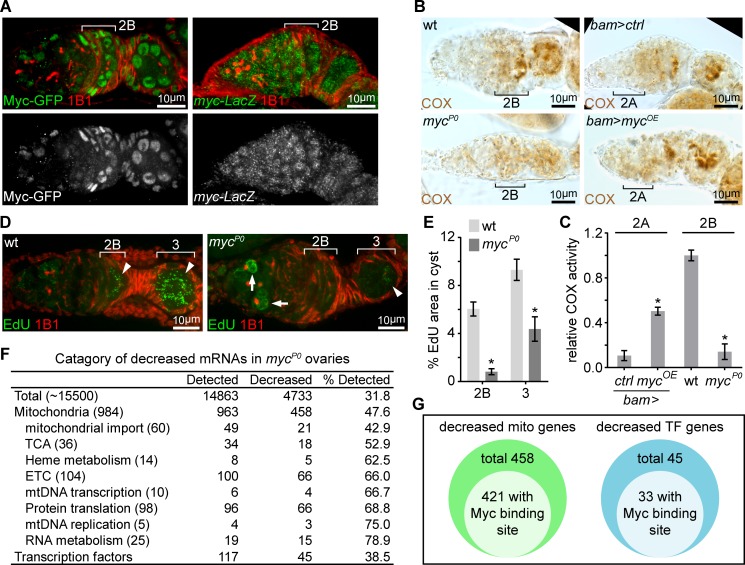
Figure 2. A candidate RNAi screen reveals Myc as an essential regulator of mitochondrial biogenesis.
(A) Left panel: germarium of a fly endogenously expressing Myc-GFP stained with anti-GFP (Green) and anti-1B1 (Red). Right panel: germarium of a fly expressing LacZ driven by the myc endogenous promoter stained with anti-β-galactosidase (Green) and anti-1B1 (Red). Myc protein is expressed at low level in GSCs and dividing cysts, but markedly induced from region 2B germ cells. In contrast, myc promoter activity is uniform in the germarium. Scale bars, 10 μm. (B) COX activity in germaria from wt, mycP0, bam >ctrl, and bam >mycOE ovaries visualized by COX single staining. The activities are normalized to that of region 2B cysts wt. COX activity is significantly reduced in the mycP0 mutant, but is ectopically induced when Myc is over-expressed in region 2A by bam-Gal4. Scale bars, 10 μm. (C) Quantifications of relative COX activity in germarium regions from wt, mycP0, bam >ctrl, and bam >mycOE flies. ETC activities is normalized to that in the wt 2B cysts. n = 10 germaria for each genotype. Error bars represent SEM. *p<0.05. (D) Visualization of mtDNA replication in germaria from wt and mycP0 ovaries with EdU incorporation (Green) and co-staining with anti-1B1 (Red). Arrowheads point to EdU incorporation into mtDNA, while arrows point to EdU incorporation into the nuclear genome. Scale bars, 10 μm. (E) Area of EdU puncta (pixels) normalized to total pixels at indicated germarium stages in the germline cysts from wt and mycP0 ovaries. n = 11 cysts for each column. Error bars represent SEM. *p<0.005. (F) Table of genes functioning in mitochondrial processes with at least 3-fold decreased expression in mycP0 ovaries compared with wt ovaries. (G) Diagrams of decreased genes encoding mitochondrial processes and transcription factors (TFs) in the mycP0 ovaries. A number of genes in either category has a Myc binding site in their regulatory region.


