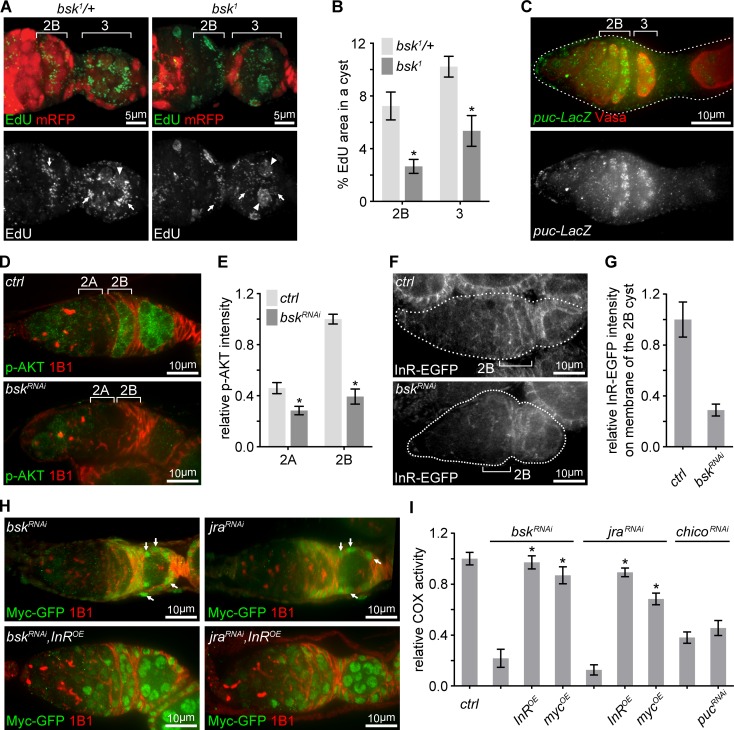
Figure 5. Transient JNK activation in the germarium boosts the IIS-Myc signaling.
(A) Representative germaria with bsk1 FRT clones showing EdU incorporation (green) to visualize mtDNA replication. bsk1/+ cells are positive for mRFP (red), while bsk1 mutant cells are negative for mRFP. Arrows indicate EdU incorporated into mtDNA, arrowheads point out EdU incorporated into the nuclear genome. Scale bars, 5 μm. (B) Percentage areas of EdU incorporated into mtDNA relative to total areas of the germline cysts at indicated germarium stages from bsk1/+ and bsk1 clones. n = 11, 14, 15, and 10 cysts each column (left to right). Error bars represent SEM. *p<0.005. (C) Germarium from ovaries expressing LacZ driven by the puc promoter stained with anti-β-galactosidase (green) and anti-Vasa (red). Germarium is outlined with dotted lines. Scale bar, 10 μm. (D) Germaria from ovaries of ctrl and bskRNAi driven by nos-Gal4 stained with anti-p-AKT (green) and anti-1B1 (red). Note that IIS activity is markedly reduced when JNK signaling is decreased by bsk RNAi. Scale bars, 10 μm. (E) Quantification of p-AKT intensity from cysts in germarium region 2A and 2B of ovaries with indicated genotypes. p-AKT intensity is normalized to that of region 2B cysts from the ctrl line. n = 11 germaria for each genotype. Error bars represent SEM. *p<0.005. (F) Visualization of InR-EGFP in germaria from ovaries of ctrl and bskRNAi driven by nos-Gal4. Note that InR-EGFP level on the region 2B cyst membrane is decreased by bsk RNAi. Germaria are outlined with dotted lines. Scale bars, 10 μm. (G) Quantification of background subtracted InR-EGFP intensity on cell membrane of the region 2B cyst. n = 7 germaria for each genotype. Error bars represent SEM. *p<0.005. (H) Germaria from ovaries of bskRNAi; bskRNAi, InROE; jraRNAi; jraRNAi, InROE driven by nos-Gal4 endogenously expressing Myc-GFP co-stained with anti-GFP and anti-1B1. Note that Myc-GFP level in germ cells is markedly lower than that in follicle cells pointed out by arrows. Scale bars, 10 μm. (I) COX activity in region 2B cysts from ovaries with indicated genotypes. The activities are normalized to that of region 2B cysts from the ctrl line. n = 10 germaria for each genotype. Error bars represent SEM. *p<0.005.


