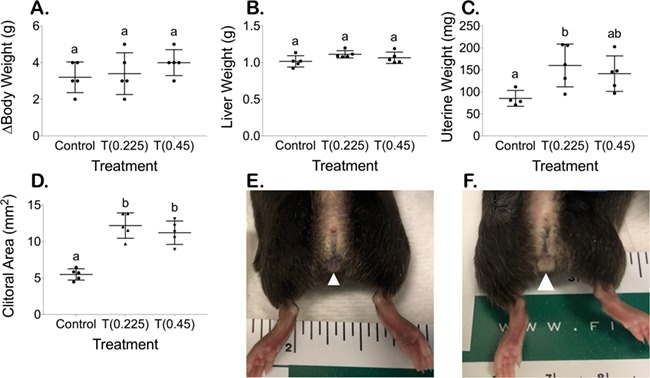
Figure 3.

Terminal body measurements (mean ± SD). (A) Increase in body weight over 6 weeks, (B) terminal liver weight (normalized to terminal average of 22.5 g mouse), (C) terminal uterine weight (normalized to terminal average of 22.5 g mouse) and (D) terminal clitoral area. Increased clitoral size between (E) controls and (F) mice treated with T, with white arrowhead pointing to clitoral structure.
