
Figure 5.
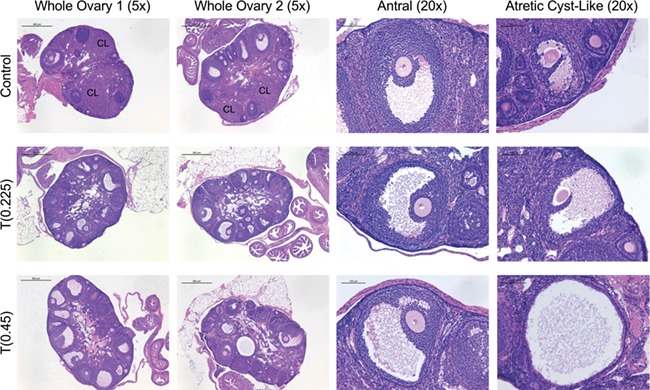
Perturbed histology in mice treated with T. Hematoxylin and eosin-stained control ovaries with corpora lutea (row 1) and T-treated ovaries at 0.225 mg (Row 2) and 0.45 mg (Row 3) after 6 weeks of treatment (Columns 1 and 2, ×5, scale 500 μm). Antral follicles with oocytes surrounded by several layers of cumulus granulosa cells from control (Row 1) and T-treated mice at 0.225 mg (Row 2) and 0.45 mg (Row 3) doses (Column 3, ×20, scale 100 μm). Atretic cyst-like late antral follicles from control (Row 1) and T-treated mice at 0.225 mg (Row 2) and 0.45 mg (Row 3) (Column 4, ×20, scale 100 μm).