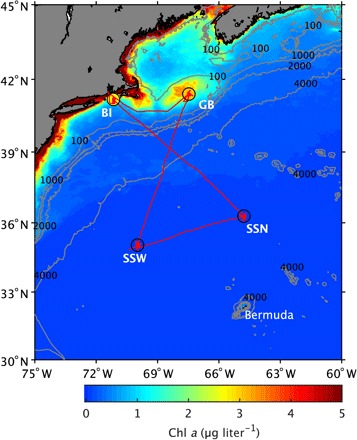
Fig. 1. Map of hydrographic stations (BI, GB, SSW, and SSN; circles), cruise track (red line), and Chl a concentrations (color field) during research cruise EN-589 aboard the R/V Endeavor.

The average Chl a concentrations during occupation of each hydrographic station are indicated by the colors of their corresponding markers. The background color field indicates the spatial distribution of monthly averaged surface Chl a concentrations retrieved by the Moderate Resolution Imaging Spectroradiometer (MODIS) sensor on the Aqua satellite from September for 2013 through 2017. Satellite-derived Chl a data were downloaded from NASA (https://disc.gsfc.nasa.gov/). Isobaths in meters are depicted by gray contour lines. Bathymetry data were downloaded from GEBCO (www.gebco.net/). Additional descriptions of each station are listed in Table 1. BI, Block Island; GB, Georges Bank; SSW, Sargasso Sea West; SSN, Sargasso Sea North.
