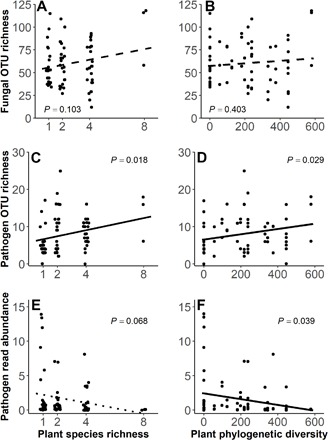
Fig. 5. Variation in total fungal richness, richness of pathogenic fungal OTUs, and read abundance of pathogenic fungi as functions of plant SR and PD in each field soil–treated pot in shade-house experiment 1.

(A and B) OTU richness was calculated on the basis of internal transcribed spacer (ITS) ribosomal DNA sequencing data in each pot. (C and D) Pathogen richness was calculated as number of fungal OTUs per pot identified as pathotrophs. (E and F) Pathogen read abundance was the percentage of the total number of fungal reads from each pot that were identified as pathogenic fungal OTUs. Each dot represents the results for an individual pot; points on the left (A, C, and E) are positioned to include a small amount of random variation along the x axis when necessary to avoid overplotting.
