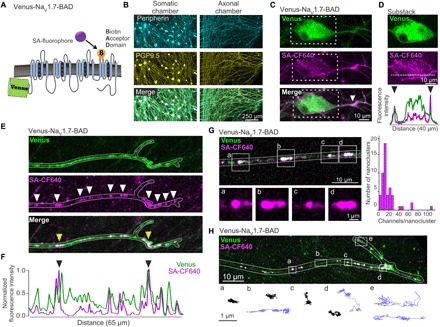
Fig. 1. Venus-NaV1.7-BAD localizes to nanoclusters on distal axons.

(A) Diagram of the Venus-NaV1.7-BAD construct showing the fusion of Venus to the N-terminus and the insertion of the BAD into the S1-S2 loop of domain IV. (B to H) DRG neurons were cultured for 7 to 10 days in microfluidic chambers (MFCs). (B) Immunolabeling of DRG neurons in MFCs express both peripherin (cyan) and PGP9.5 (yellow) in both the somatic (left) and axonal (right) chambers. (C) Compressed confocal z-stack of a DRG neuron within the MFC somatic chamber expressing Venus-NaV1.7-BAD, showing the distribution of the Venus signal (top), surface labeling with SA-CF640 (middle), and merge (bottom). The surface labeling reveals a region of the proximal axon with increased density of NaV1.7 (white arrow). (D) A substack of the z-slices from (C) chosen from the center of the soma to demonstrate the surface labeling (magenta) surrounding the somatic cytoplasm containing the total NaV1.7 protein (green). Bottom panel shows line scans of the normalized fluorescence intensity of the Venus (green) and SA-CF640 (magenta) signals along the line scan (dashed white line; middle). The black arrowheads indicate the increased fluorescence intensity of the SA-CF640 surface labeling at the plasma membrane. (E) Compressed confocal z-stack of a distal axon from the MFC axonal chamber. Both the Venus signal (top) and surface labeling (middle) demonstrate localization of channels to nanoclusters along the axonal membrane (white arrows). (F) Line profile of the fluorescence intensity of the distal axon in (E), normalized to the maximum fluorescence intensity. Peaks in the line profile corresponding to the clusters of channels along the axon. This example shows two clusters that are noticeably brighter than the others [yellow arrows in (E) and black arrows in (F)]. (G) Estimation of the number of channels per axonal nanocluster. The average fluorescence intensity of single molecules was determined by creating a histogram of individual channel intensities. Fluorescence intensities of nanoclusters were divided by this value to approximate the number of channels in each nanocluster. (H) Single-molecule tracks of individual surface labeled Venus-NaV1.7-BAD channels on a distal axon. A compressed z-stack was used to demonstrate the overall morphology of a distal axon (outlined in white) expressing Venus-NaV1.7-BAD where the overlay between the Venus signal (green) and surface labeling (magenta) appears as white. Tracks are representative molecule behaviors from the regions indicated by the white boxes (boxes a to e). Molecules near the distal end and between nanoclusters show relatively high mobility (blue trajectories), while channels within the nanoclusters display low mobility (black trajectories).
