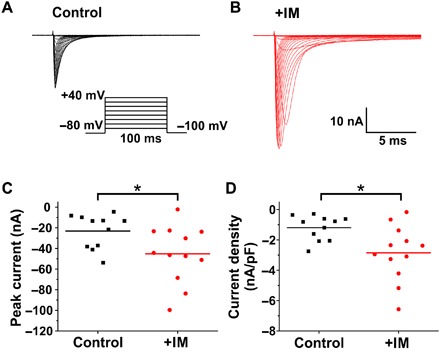
Fig. 4. NaV1.7 current density increases following treatment with IM.

(A and B) Family of current traces evoked by 100-ms depolarizing voltage steps from −80 to +40 mV in 5-mV increments from a holding potential of −100 mV. Representative traces from NaV1.8-null DRG neurons expressing NaV1.7 channels in (A) control (black) and (B) IM-treated (IM; red) neurons. (C) Comparison of peak inward current between control (black) and IM-treated conditions (red). (D) Scatter plot showing enhanced current density in DRG neurons treated with IM. Current density was measured by normalizing maximal peak currents with cell capacitance. The bars indicate the means; *P < 0.05, two-sample t test.
