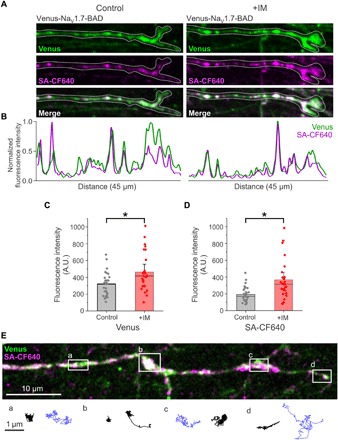
Fig. 6. Enhanced surface expression of NaV1.7 channels after incubation with IM.

DRG neurons expressing Venus-NaV1.7-BAD were cultured in MFCs for 7 to 10 days. Treatment dishes were exposed to IM in both the somatic and axonal chambers for 4 to 5 hours before imaging. (A) Compressed z-stacks of distal axons under control conditions (left) and after exposure to IM (right). Under both conditions, nanoclusters can be seen along the distal axon with both the Venus signal (green) and CF640 surface labeling (magenta). (B) Line profile of the axons in (A) showing fluorescence intensity normalized to the maximum fluorescence intensity, with peaks representing nanoclusters of NaV1.7. (C and D) Quantification of the fluorescence intensity of the Venus signal (C) and CF640 surface labeling (D) shows significantly more surface labeling at distal axons after incubation with IM versus control conditions. *P< 0.01, two-sample t test (C), Mann-Whitney U test (D). (E) Single-molecule tracks of individual surface labeled Venus-NaV1.7-BAD channels on a distal axon. A compressed z-stack is used to demonstrate the overall morphology of a distal axon expressing Venus-NaV1.7-BAD where the overlay between the Venus signal (green) and surface labeling (magenta) appears as white. The white dots along the axon represent the location of axonal NaV1.7 nanoclusters. The lines below the picture represent the trajectories of single molecules over time, tracked from time-lapse movies. Black lines represent molecule tracks with relatively low mobility, while blue lines represent molecule tracks with higher mobility. Tracks are representative of single-molecule behaviors from the regions indicated by the white boxes (boxes a to d).
