
Fig. 1. Accuracy of inference on simulated and real data.
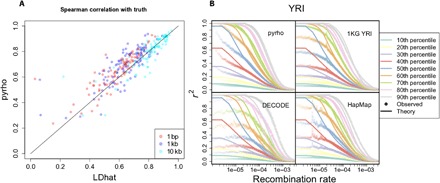
(A) Spearman correlation between inferred and true maps for 100 simulations, each 1 Mb long, for both pyrho and LDhat, with our method showing improved performance especially at finer scales. (B) Our inferred recombination maps provide a better fit to observed patterns of linkage disequilibrium as measured by r2. For a pair of SNPs, r2 is a random quantity and depends on the rate of recombination between the SNPs. Solid lines show theoretical deciles of this distribution for pairs of sites separated by different recombination distances with MAF >0.1 at both sites as calculated under the population size for YRI in Fig. 2A. Shaded points are the deciles of the empirical distribution obtained by considering pairs of sites with MAF >0.1 binned by the recombination rate separating them according to the different recombination maps. 1KG YRI is the population-specific recombination map for YRI in (15); DECODE is the sex-averaged recombination map in (28); and HapMap is the recombination map in (34).