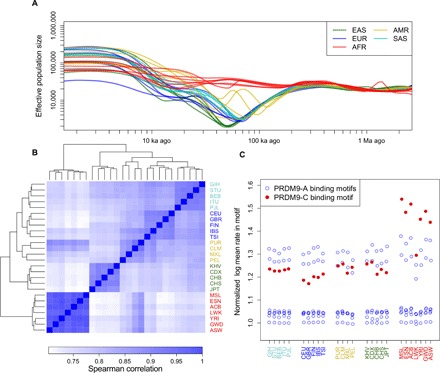
Fig. 2. Interplay of demographic history and fine-scale recombination rates.

(A) Population sizes as inferred by smc++. All non-African populations show an out-of-Africa bottleneck, which is deepest in East Asian populations. (B) Heatmap of the Spearman correlation between the inferred recombination maps at single–base pair resolution. All maps show a high degree of correlation, yet the relative correlations agree with continental levels of population differentiation. (C) Recombination rates at different PRDM9 binding motifs in each population, normalized by the log average recombination rate in a shuffled version of that motif. PRDM9-A binding motifs show consistent recombination rates across all populations, while PRDM9-C binding motifs show particularly elevated rates in African populations. Three-letter population codes are defined in Table 1.
