
Fig. 4. PRDM9 and chromatin structure shape fine-scale recombination rates.
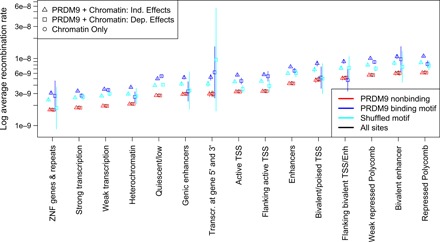
Different chromatin states have substantially different average recombination rates as determined by fitting a model using only chromatin state (Chromatin only), a model with independent chromatin state and PRDM9 binding effects (PRDM9 + Chromatin: Ind. Effects), and a model where PRDM9 binding may have a different effect in different chromatin states (PRDM9 + Chromatin: Dep. Effects). Sites characterized by H3K27me3 marks (bivalent states and regions repressed by Polycomb) have the highest recombination rates, while repetitive regions, transcribed regions, and heterochromatic or quiescent regions all have depressed recombination rates. ZNF, zinc finger genes; TSS, transcription start site.