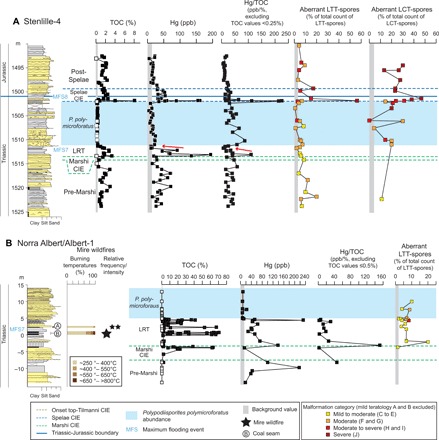
Fig. 4. TOC, Hg loading and Hg/TOC, and total teratology for Stenlille-4 and Norra Albert/Albert-1.

(A) Stenlille-4 and (B) Norra Albert/Albert-1. The LTT- and LCT-spore teratology is expressed as percentage of the total number of specimens counted within each genus per sample, as well as total severity of sample expressed as colors. Lithology and intervals used to subdivide the TJB succession mainly after (36). Red arrows on (A) mark levels where Hg and Hg/TOC decrease, while TOC levels remain high. Note that TOC values below the detection levels are marked with white squares and that no Hg/TOC values were generated for these samples.
