
Figure 4. MTAP expression is correlated with altered gene expression profiles and decreased survival in GBM patients.
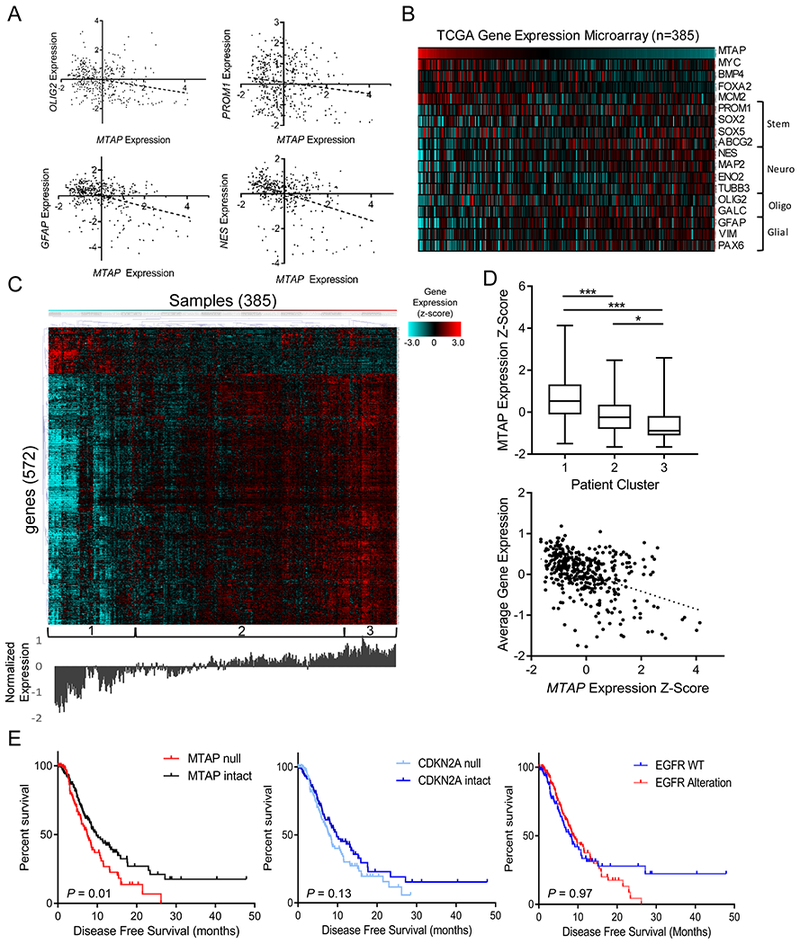
(A) Gene expression data from TCGA shows significant correlation between MTAP expression and various stemness/differentiation markers (n=385; OLIG2 R2 = 0.06, P value < 1×10⁻⁴; PROM1 R2 = 0.02, P value = 0.005; GFAP R2 = 0.16, P value < 1×10⁻⁴; Nestin R2 = 0.17, P value < 1×10⁻⁴). (B) Heatmap showing expression of MTAP and assorted stemness/differentiation genes from TCGA gene expression dataset, n=385 samples. (C) Heatmap showing gene expression (z-score) of the most differentially expressed genes between low– and high–MTAP-expressing cases in TCGA GBM dataset. Genes were selected using a t test comparing the expression of 12,400 genes available in the Affymetrix microarray platform between 33% of patients with lowest MTAP expression (128 patients) and 33% of patients with highest MTAP expression and selecting all genes with a P value <4×10⁻⁶. Unsupervised hierarchical clustering revealed clusters labeled at the bottom. Average expression level for the included genes is shown below the heatmap. (D) Average MTAP expression (top) was calculated for the 3 clusters labeled in (c) with a t test P value ***<.001, *<.05, whiskers show min to max. A simple regression analysis (bottom) shows a significant correlation between MTAP expression and overall gene expression levels in this gene set (R2 = 0.19, P value = 2.2×10⁻¹⁶). (E) Data from 281 TCGA GBM patients shows a significant decrease in progression-free survival among patients with MTAP deletion (left, log-rank P value = 0.01, median survival 7.4 vs 9.7 months) but not with CDKN2A deletion (middle, log-rank P value = 0.13) or EGFR amplification (right, log-rank P value = 0.97). See Supplementary Fig. S6 for mutation co-occurrence.