
Figure 5. MTAP deletion results in functional DNA methylation changes.
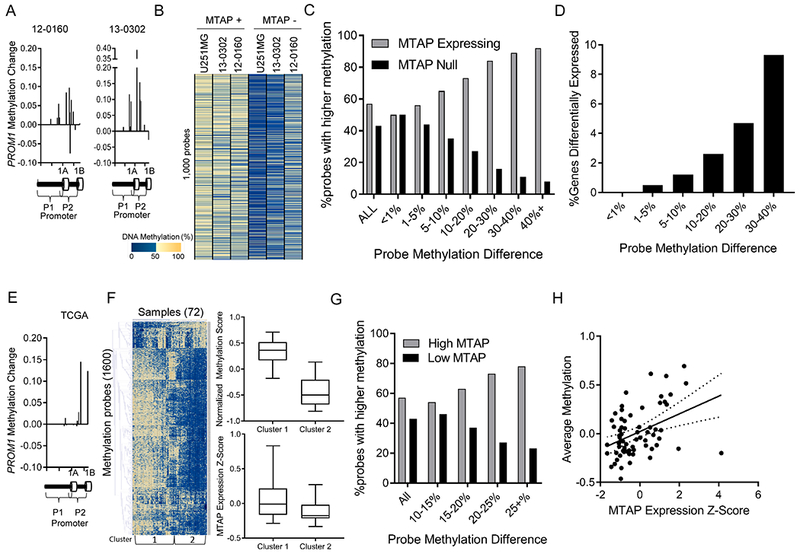
(A) Methylation probes in the PROM1 promoter have increased methylation beta value after MTAP restoration in GBM cell lines. (B) Analysis of the most differentially methylated loci between isogenic in vitro cultures measured by the MethylationEPIC 850k array shows a pattern of hypomethylation in MTAP-null cells. (C) Genes were sorted into bins based on the average methylation difference between MTAP-expressing and MTAP-null isogenic cell pairs (12-0160, 13-0302, U251MG). Bars represent the percent of probes in each bin represented by either the MTAP-expressing (grey) or MTAP-null (black) cell. Genomic loci with a high methylation difference between isogenic pairs are more likely to be hypomethylated in MTAP null cells. (D) Percentage of genes with greater than 2-fold expression change based on degree of methylation change (x-axis) following change of MTAP status in isogenic cell pairs. (E) Analysis of the PROM1 promoter in TCGA dataset using the illumina 450k methylation array shows higher methylation in samples with high MTAP expression compared to samples with low MTAP expression, n=72 samples. (F) Heatmap shows 1,600 methylation probes selected using a t test comparing the 24 patients with lowest MTAP expression to the 24 patients with highest MTAP expression (N=72 patients total). All probes with a Bonferroni-corrected P value < 4×10⁻⁶ were included, without direction bias. Unsupervised hierachical clusters were analyzed for average methylation across all genes (top right, t test P value < 1×10⁻⁶) and for average MTAP gene expression (bottom right, Kruskal-Wallis P value < 1×10⁻⁴). (G) Methylation 450k array data from 72 TCGA patients. For each CpG locus, average methylation between the 24 patients with lowest MTAP expression was compared with average methylation of 24 patients with highest MTAP expression. (H) Methylation values for all CpGs that have at least a 15% differential methylation identified in panel G were averaged together for each of the 72 samples and compared with MTAP expression, showing a significant positive correlation between MTAP expression and DNA methylation (correlation coeffecient = 0.44 , R2 = 0.19 , P value = 3×10⁻⁴).