
Figure 6. Purine deprivation therapy targets MTAP-null, CD133-positive GBM cells.
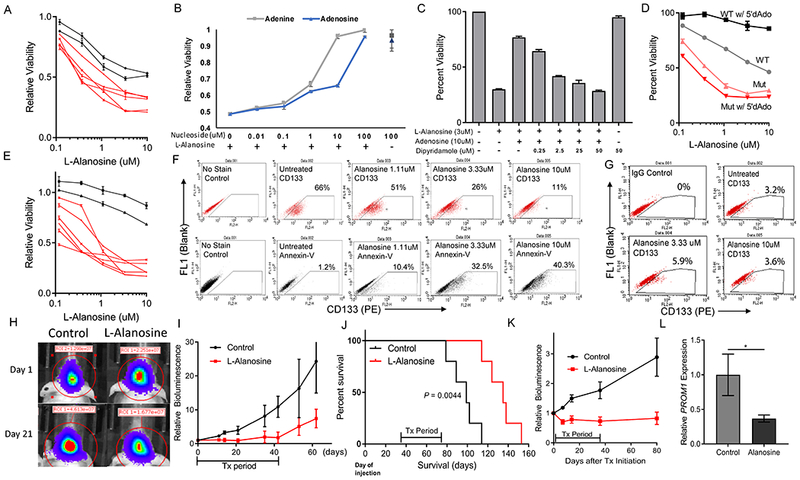
(A) L-alanosine dose response curves were measured for 7 different patient-derived GBM cell lines, showing differential sensitivity to L-Alanosine based on MTAP status. Red lines = MTAP deleted, Black lines = MTAP WT. Cell viability is measured by CCK8. (B) Supplementation of culture media with exogenous purines (adenine or adenosine) rescues MTAP-null 13-0302 cells from L-alanosine toxicity. (C) Inhibition of purine ENT1/2 transporters with dipyridamole blocks adenosine-mediated rescue of L-alanosine treated 13-0302 cells. (D) Differential sensitivity to L-alanosine conferred by MTAP status is magnified with the addition of exogenous MTAP substrate 5’dAdo. MTAP deleted cells (12-0160) shown in red, MTAP wildtype cells (12-0358) shown in grey/black. (E) L-Alanosine + 5’dAdo (30uM) treatment of the same cell lines shown in panel A, with cell viability measured by CCK8. (F) MTAP-null 13-0302 cells were treated with L-alanosine for 3 days then stained with PE-conjugated anti-CD133 antibodies or PE-conjugated Annexin V and quantified by flow cytometry. Flow cytometry shows that L-Alanosine specifically depletes CD133+ cells in a dose-dependent fashion (top), and induces apoptosis as measured by Annexin V quantification (bottom). (G) MTAP WT 12-0358 cells were treated with the indicated doses of L-Alanosine for 3 days and stained with PE-conjugated anti-CD133 antibodies. (H) Representative images of 12-0160 intracranial xenograft tumor response to L-Alanosine (225 mg/kg, i.p.) on day 21 of treatment, measured by bioluminescence. (I) Average bioluminescent values for 12-0160-luciferase intracranial xenografts, n=5 mice per arm. Treatment was started 35 days after cell injection. Mice were treated with i.p. L-Alanosine daily for 42 days. First sacrifice of control animals corresponds with the last day of treatment (day 42), subsequent data points on this control curve are skewed downwards because of loss of bioluminescent signal from sacrificed animals, ANOVA P-value = 0.0009. (J) Kaplan-Meier curves showing prolonged survival of alanosine-treated animals from panel I. Median Survival = 99 vs 135 days, log-rank P-value < 0.0044. (K) Average bioluminescence values showing response of 13-0302 intracranial xenografts to L-Alanosine (225mg/kg), n=7 animals per arm. Treatment began 15 days after cell injection and mice were treated for 35 days (ANOVA P-value < 1×10⁻⁴). (L) PROM1 expression was measured by RT-PCR using RNA from L-Alanosine-treated 12-0160 intracranial xenograft tissue (n = 6 samples per condition, each sample was measured in triplicate in 2 independent experiments, P < 0.05).