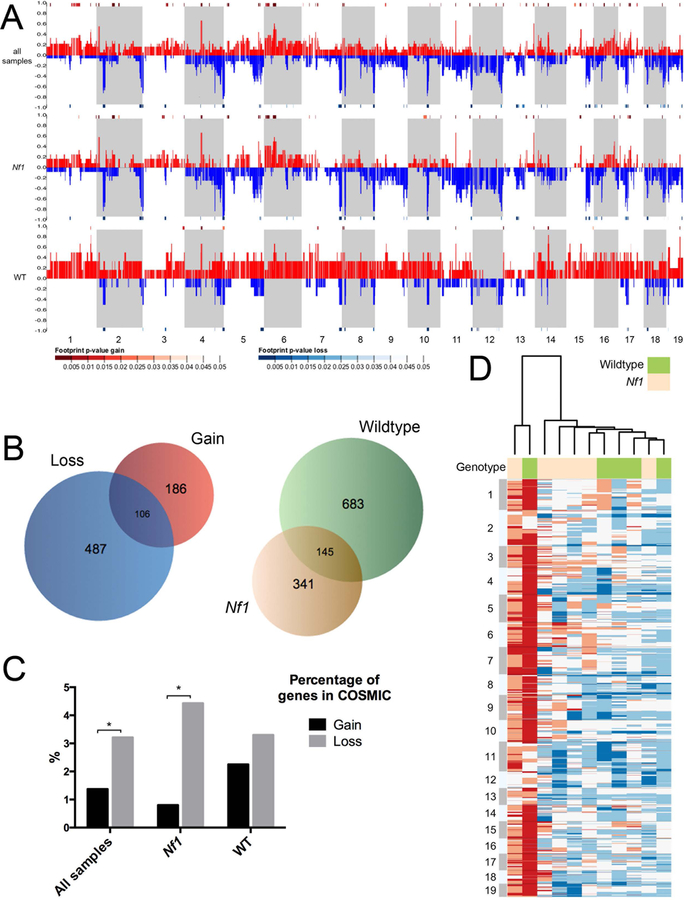
Figure 3. Copy number alteration shared between WT and Nf1 mutant backgrounds.
Control-FREEC software was used to compare read numbers between tumors and germline control in order to estimate copy number alterations in tumors. A. Genome-wide copy number alterations in all malignancies (top row), Nf1 tumors alone (middle row) and wildtype tumors alone (bottom row). Alternating stripes indicate consecutive chromosomes, beginning with chromosome 1 at the far left. The proportion of samples showing gain is displayed in red, and loss in blue. Significantly altered areas, as calculated using STAC (Diskin et al., 2006),are indicated by heatmap bars directly above the chromosomal area for gain, and below for loss (p < 0.05 shown). Overall, Nf1 mutant-derived samples showed far more copy number losses than gains (23% versus 8%), while wildtype-derived tumors showed the opposite pattern, demonstrating fewer losses than gains (9% versus 29%).
B. Unsupervised hierarchical clustering analysis was performed on copy number variation (CNV) data to organize sarcomas from wildtype and Nf1 mutant mice into groups sharing similar patterns of copy number alterations. The heatmap shows CNVs smoothed into 15 kb windows with white indicating normal copy number, blue indicating loss and red indicating gain. See also Tables S8 and S9.
C. Venn diagrams depicting: left, the numbers of genes affected by significant copy number change that are gained in all sarcomas (red), lost in all sarcomas (blue), or both (intersection); right, the numbers of genes affected by significant copy number change that are altered in Nf1 sarcomas (tan), wildtype sarcomas (green), or altered in both (intersection).
D. Bar graph displays the percentage of genes in the COSMIC database that are involved by either copy number gain or loss in all sarcomas (left), Nf1 mutant sarcomas (middle), or wildtype sarcomas (right). Student’s t-test, *p < 0.05.

