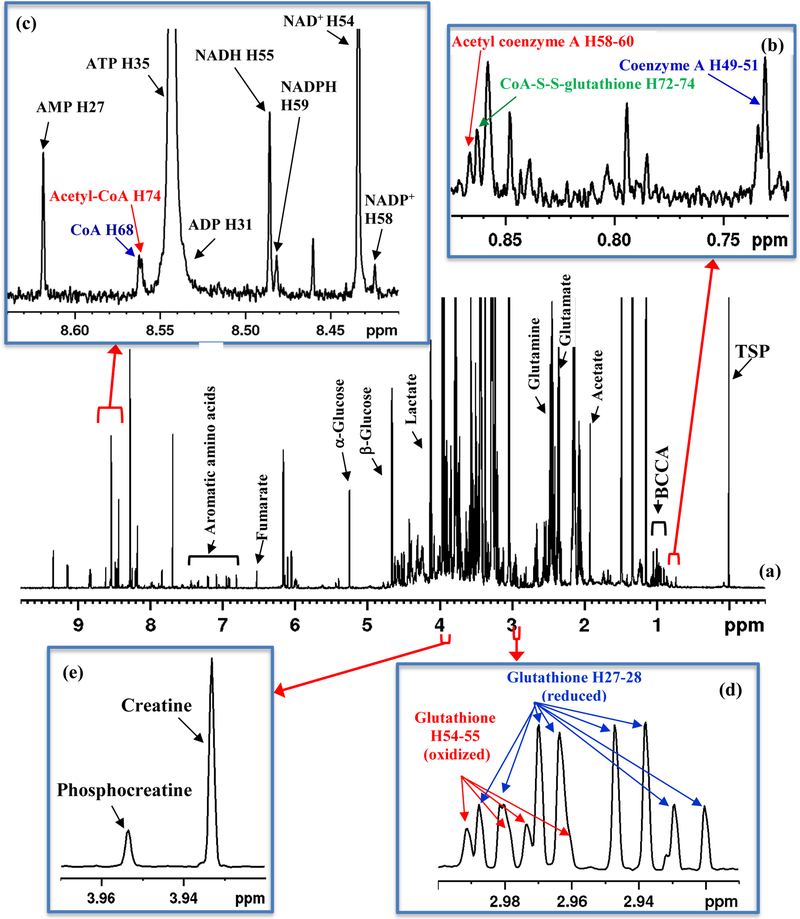
Figure 1.
(a) Typical 800 MHz 1H NMR spectrum of a mouse heart tissue extract with labeling of some of the metabolites: BCCA: branched chain amino acids; TSP: reference peak; (b-e) expanded spectral regions highlighting characteristic peaks for (b) coenzyme A (CoA), acetyl coenzyme A (acetyl-CoA) and coenzyme A glutathione disulfide (CoA-S-S-G); (c) CoA, acetyl-CoA, oxidized nicotinamide adenine dinucleotide (NAD+), oxidized nicotinamide adenine dinucleotide phosphate (NADP+), reduced nicotinamide adenine dinucleotide (NADH), reduced nicotinamide adenine dinucleotide phosphate (NADPH), adenosine triphosphate (ATP), adenosine diphosphate (ADP) and adenosine monophosphate (AMP); (d) reduced glutathione (GSH) and oxidized glutathione (GSSG); and (e) creatine (Cr) and phosphocreatine (PCr). Peak labels for coenzymes correspond to the hydrogen atom labeling based on the recently developed ALATIS, which creates a unique and atom-specific InChI labels (Figure S3).38

