Figure 6.

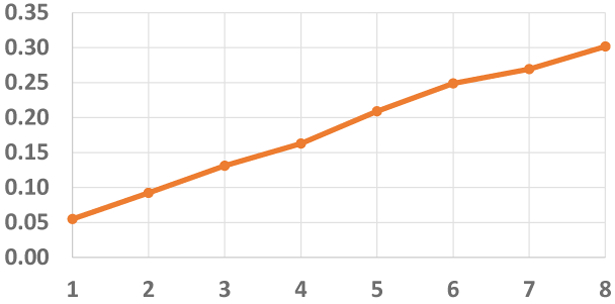
Smart Homes - Energy Prediction: The horizontal (resp., vertical) axis shows the level of parallelization (resp., throughput in million tuples/sec).

Smart Homes - Energy Prediction: The horizontal (resp., vertical) axis shows the level of parallelization (resp., throughput in million tuples/sec).