
Extended Data Figure 10. Tumor purity analysis.
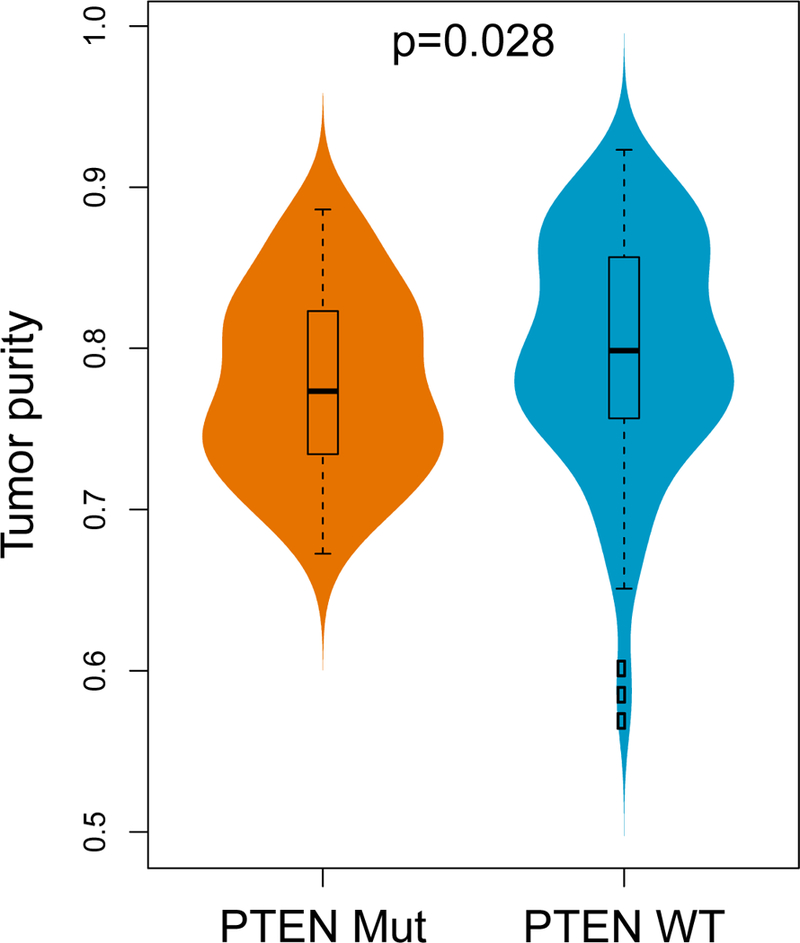
PTEN-mutated GBM tumors have significantly lower tumor purity compared to PTEN-wild-type tumors (n = 172, two-sided Wilcoxon rank-sum test). The boxplot shows the median, interquartile range, and whiskers (1.5 times interquartile range); the violin plot represents sample distributions via kernel density estimation.