
Figure 2. Mutational landscape, genomic correlates of response, and tumor evolution under anti-PD-1 therapy.
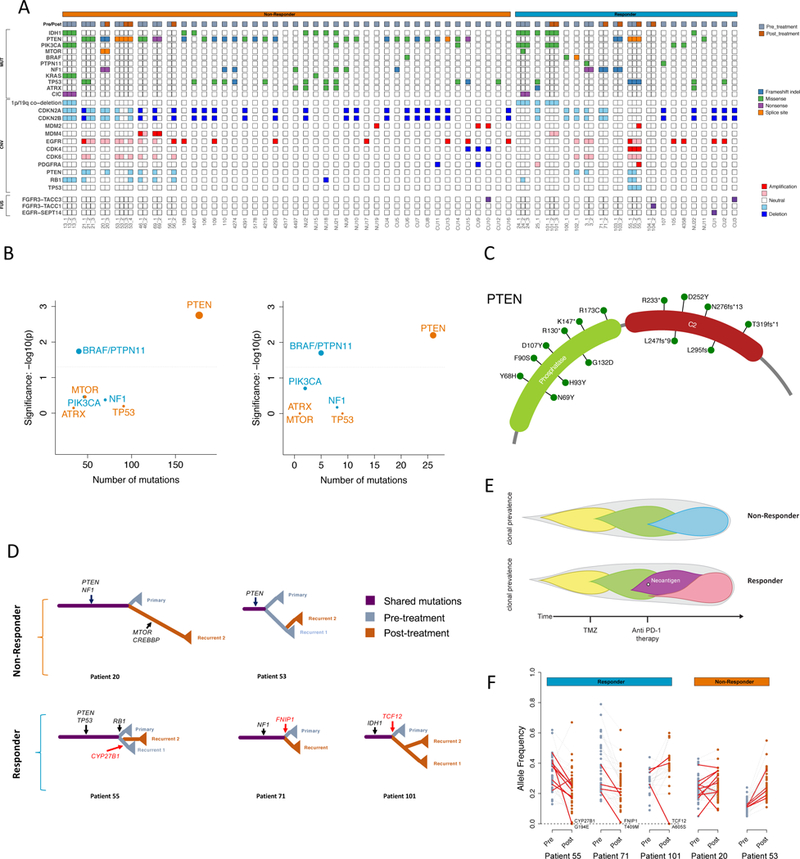
(A) Clinical and genetic profiles of the cohort. (B) Enrichment of BRAF/PTPN11 and PTEN mutations in tumors from responders and non-responders, respectively, compared to the TCGA-GBM background (left, n = 503 patients) and within the cohort (right, n = 45 patients); two-tailed Fisher’s exact test, see Methods. (C) Locations of identified mutations within the PTEN protein. (D) Evolutionary trees of 5 patients (2 non-responders & 3 responders) evaluated by whole-exome sequencing. Selected driver mutations are labeled in black. The variants that were eliminated after anti-PD-1 therapy and predicted to generate neoantigens are labeled in red. (E) Different tumor evolution models characterize non-responders and responders. The upper panel represents non-responders following a linear pattern of evolution. The lower panel represents responders following a branching pattern of evolution, with the elimination of a clone possessing a neoantigen after anti-PD-1 therapy. (F) Variant allele frequency of protein coding mutations before and after immunotherapy. Predicted expressed neoantigens are depicted in red.