
Extended Data Figure 3. Additional analysis of transcriptomic correlates of response to anti-PD-1 immunotherapy.
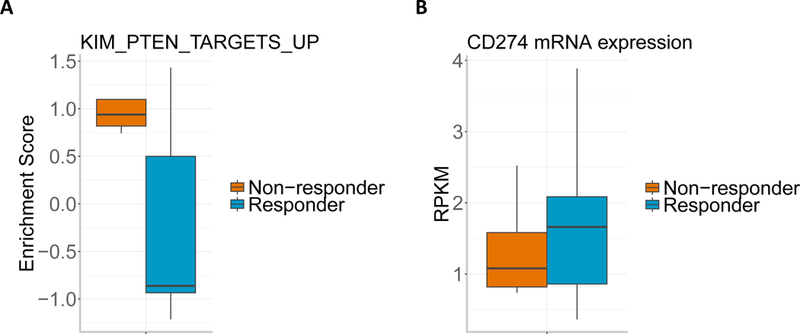
(A) GSEA enrichment score of gene set KIM_PTEN_TARGETS_UP for non-responders vs responders (n=12 patients). The boxplot shows the median, interquartile range, and whiskers (1.5 times interquartile range). (B) Boxplot of CD274 (encoding PD-L1) mRNA expression in responders vs. non-responders (n=12 patients). The boxplot shows the median, interquartile range, and whiskers (1.5 times interquartile range).