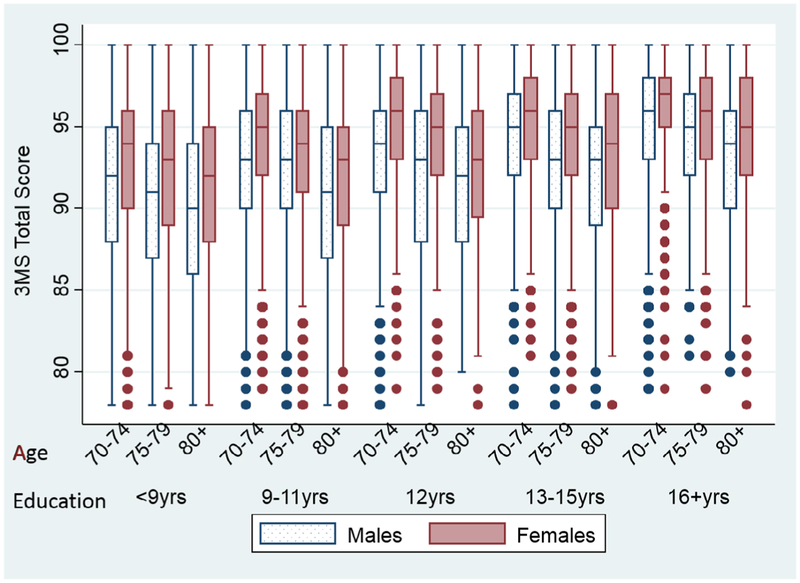
Figure 5.
Modified Mini-Mental State (3MS) examination scores in Australian whites, according to demographic characteristics (n = 16,360). The box represents the interquartile range (IQR, 25–75% percentile) and the horizontal line the median. The whiskers extend to +/−1.5*IQR and the dots represent outlying observations (≥1 participant) that are above or below these limits for 75 and 25% percentile, respectively.

