
Figure 1.
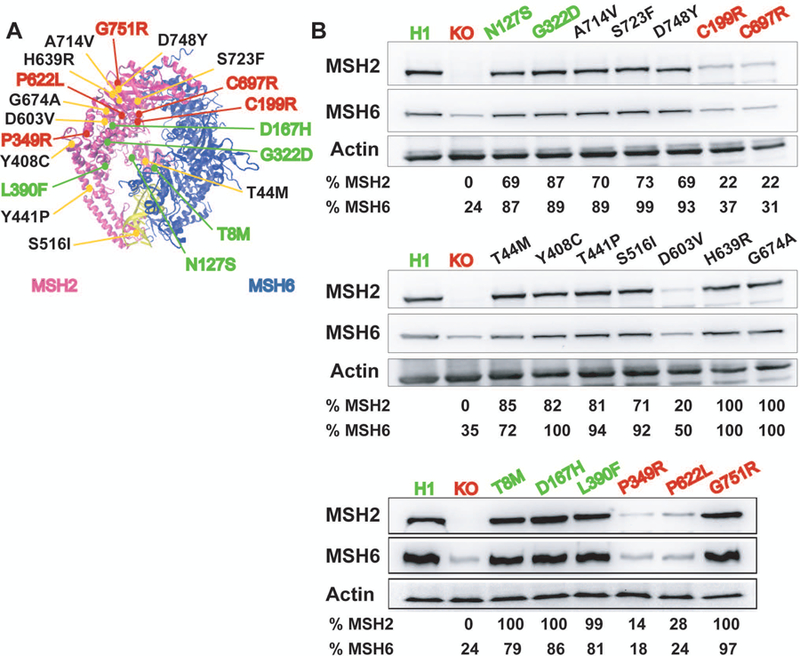
MSH2 variants tested and quantification of MSH2 and MSH6 steady-state protein levels. A: The MSH2 missense variants examined in this study as mapped to the DNA bound MSH2-MSH6 crystal structure (Warren et al., 2007). DNA is shown in yellow. B: Steady-state level of MSH2 and MSH6 proteins in each of the engineered MSH2 variant expressing lines is shown. Wild type H1 and MSH2 Class 1 benign variants are depicted in green. MSH2 KO and Class 5 pathogenic variants are shown in red. Actin was used as a loading control. Relative MSH2 and MSH6 levels were calculated with respect to the level in H1 WT cells after normalization for total protein loading.