
Figure 3.
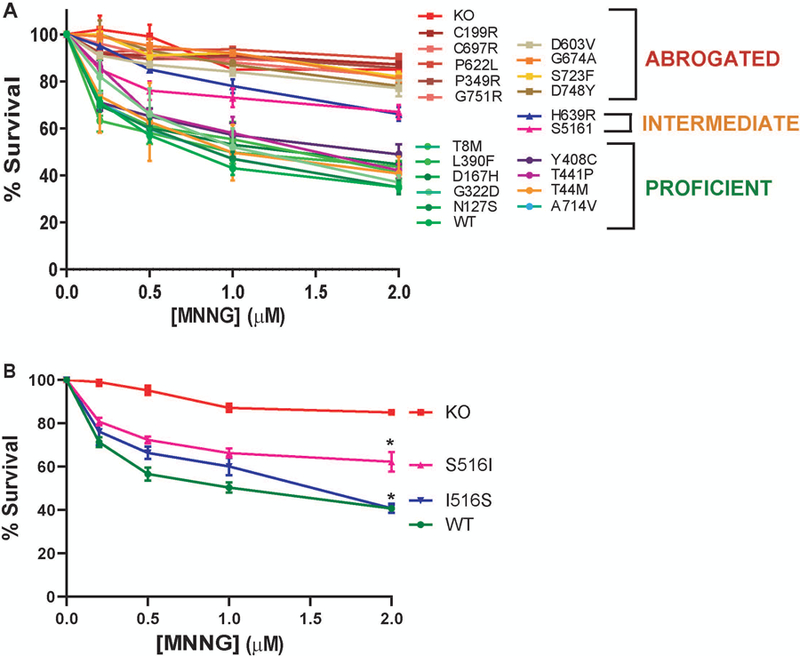
The MMR dependent damage response in variant cell lines. Cell survival as measured by MTT assay showing percentage survival after 24 h treatment with increasing doses of the DNA alkylating agent MNNG in the indicated cell lines. The values are represented as the mean ± S.E.M. N = 3–5. A: Survival curves for 10 VUS lines along with 10 control variants, and WT and MSH2 knockout (KO) controls. A statistical clustering analysis was performed which grouped the variants into three populations based on their survival. One cluster resembled the Abrogated controls, one cluster resembled the Proficient controls and a third resembled an Intermediate cluster. B: Survival curves for S516I line and I516S reversion mutant line. *, p < 0.05