Figure 3:
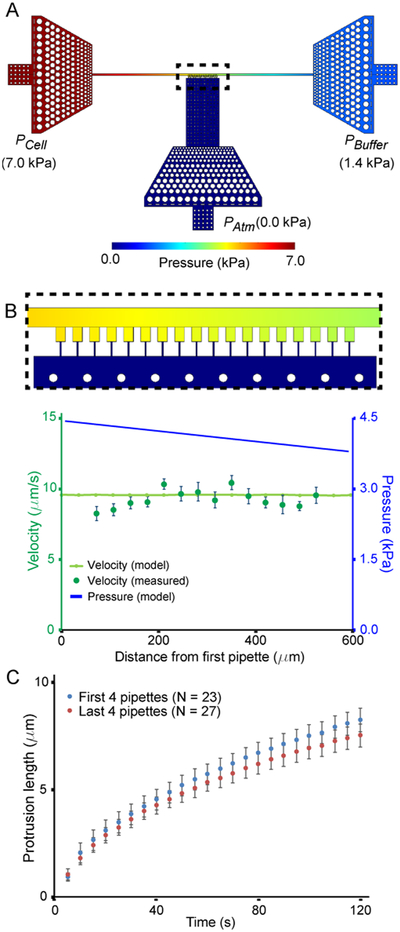
Modeling of the pressure distribution across the device. (A) Pressure distribution obtained from 3-D computational model in the condition in which the micropipette channels are closed, corresponding to experimental conditions in which all the channels are blocked by cells. (B) Comparison of the model predictions for the pressure distribution and resulting fluid velocity distribution in the main channel with experimental measurements. The velocity (light green line) determined from the pressure gradient (top figure and blue curve) was compared to the flow velocity determined from fluorescent beads (dark green points). (C) Deformation of wild-type MEFs in the first four micropipette channels (blue) compared to the last four micropipette channels (red). The differences between the first four and the last four channels is not statistically significant, consistent with the predictions of the models. Similar results obtained from independent experiments with another cell line are included in Supp. Fig. 2A.

