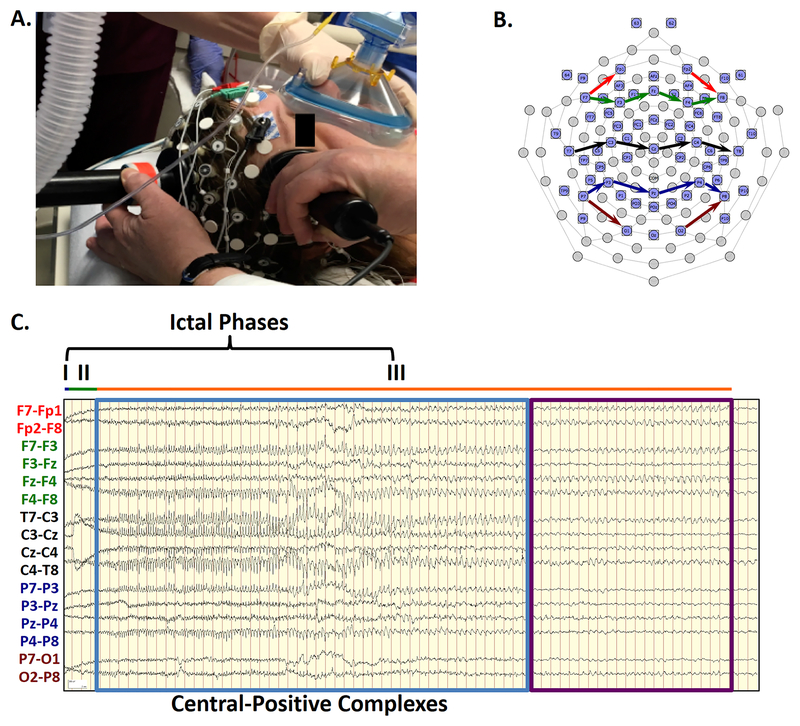
FIGURE 1: Ictal Phases Following ECT Charge Delivery.
1A. Modified 64-channel EEG sensor net allows high-density EEG recording without interference with ECT stimulation electrode placement. 1B. The sensor net diagram shows the localization of the standard 10–20 electrode locations. Arrows indicate the locations of the recording chains of the bipolar transverse montage in FIGURE 1C. 1C. High-amplitude complexes are demonstrated in a bipolar transverse montage. The electrodes contributing to each EEG channel in a chain are connected by color-coded arrows on the electrode map. Intervals for the different ictal phases are depicted (blue, very short Phase I; green, Phase II; orange, Phase III). As each hash mark represents one second, clearly-formed, rhythmic complexes (blue box) arise by the 8th second of the record, with the highest differential amplitudes over the midline chain (black). The polarity of the complexes shifts from relatively negative polarity (upward deflection) to relatively positive (downward deflection) following the chain from the left (T7) to the right (T8), identifying localization at the vertex electrode (Cz). These complexes were initially at a frequency of 4.0 Hz but gradually decreased to 2.0 Hz. At second 50, these complexes abruptly stop, while the seizure continues for another 21 seconds of Phase III (purple box). Signals have been bandpass filtered from 1–70 Hz.

